| Param | Original file | Final file |
|---|---|---|
| Filename | modeM0/AS1G06_135T03_9000000944cztM0_level2.evt | modeM0/AS1G06_135T03_9000000944cztM0_level2_quad_clean.evt |
| Size (bytes) | 1,108,667,520 | 209,160,000 |
| Size | 1.0 GB | 199.5 MB |
| Events in quadrant A | 8,006,664 | 1,318,184 |
| Events in quadrant B | 7,815,730 | 1,338,675 |
| Events in quadrant C | 7,544,687 | 1,316,999 |
| Events in quadrant D | 9,121,758 | 1,252,646 |
| Mode SS | |||
|---|---|---|---|
| Quadrant | BADHDUFLAG | Total packets | Discarded packets |
| A | 0 | 328 | 0 |
| B | 0 | 328 | 0 |
| C | 0 | 328 | 0 |
| D | 0 | 328 | 0 |
| Mode M9 | |||
|---|---|---|---|
| Quadrant | BADHDUFLAG | Total packets | Discarded packets |
| A | 0 | 6 | 0 |
| B | 0 | 6 | 0 |
| C | 0 | 6 | 0 |
| D | 0 | 6 | 0 |
| Mode M0 | |||
|---|---|---|---|
| Quadrant | BADHDUFLAG | Total packets | Discarded packets |
| A | 0 | 34784 | 0 |
| B | 0 | 34499 | 0 |
| C | 0 | 33969 | 0 |
| D | 0 | 38670 | 0 |
| Quadrant | Total seconds | Saturated seconds | Saturation percentage |
|---|---|---|---|
| A | 16067 | 155 | 0.964710% |
| B | 16067 | 287 | 1.786270% |
| C | 16067 | 146 | 0.908695% |
| D | 16067 | 465 | 2.894131% |
Noise dominated data is calculated using 1-second bins in cleaned event files. If a bin has >2000 counts, and if more than 50% of those come from <1% of pixels, then it is considered to be noise-dominated and hence unusable.
| Quadrant | # 1 sec bins | Bins with >0 counts | Bins with >2000 counts | High rate bins dominated by noise | Noise dominated (total time) | Noise dominated (detector-on time) | Marked lightcurve |
|---|---|---|---|---|---|---|---|
| A | 16767 | 16073 | 1 | 1 | 0.01% | 0.01% |  |
| B | 16767 | 16073 | 32 | 32 | 0.19% | 0.20% |  |
| C | 16767 | 16073 | 25 | 25 | 0.15% | 0.16% |  |
| D | 16767 | 16073 | 238 | 238 | 1.42% | 1.48% | 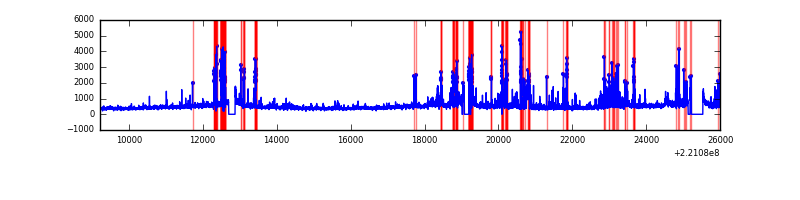 |
Top three noisy pixels from each quadrant. If the there are fewer than three noisy pixels in the level2.evt file, extra rows are filled as -1
| Pixel properties | Quadrant properties | ||||||
|---|---|---|---|---|---|---|---|
| Quadrant | DetID | PixID | Counts | Sigma | Mean | Median | Sigma |
| A | 8 | 15 | 542441 | 1433.16 | 1872 | 1829 | 377.2 |
| A | 15 | 239 | 223149 | 586.72 | 1872 | 1829 | 377.2 |
| A | 13 | 251 | 18162 | 43.3 | 1872 | 1829 | 377.2 |
| B | 0 | 228 | 347673 | 974.64 | 1881 | 1832 | 354.8 |
| B | 15 | 204 | 40131 | 107.93 | 1881 | 1832 | 354.8 |
| B | 0 | 219 | 37679 | 101.02 | 1881 | 1832 | 354.8 |
| C | 10 | 22 | 265542 | 628.22 | 1819 | 1825 | 419.8 |
| C | 9 | 247 | 121506 | 285.1 | 1819 | 1825 | 419.8 |
| C | 9 | 68 | 22883 | 50.16 | 1819 | 1825 | 419.8 |
| D | 2 | 33 | 654713 | 1492.23 | 1792 | 1732 | 437.6 |
| D | 2 | 216 | 498020 | 1134.15 | 1792 | 1732 | 437.6 |
| D | 14 | 34 | 431076 | 981.16 | 1792 | 1732 | 437.6 |
Histogram calculated using DETX and DETY for each event in the final _common_clean file
| Quadrant A |  |
 |
Quadrant B |
|---|---|---|---|
| Quadrant D |  |
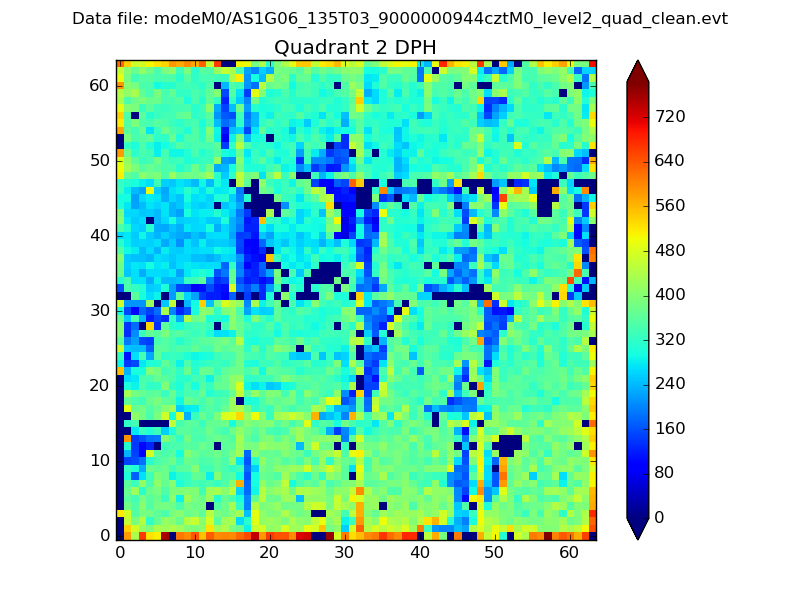 |
Quadrant C |
| Plot type | Count rate plots | Images |
|---|---|---|
| Comparison with Poisson distribution Blue bars denote a histogram of data divided into 1 sec bins. Red curve is a Poisson curve with rate = median count rate of data. |
 |
 |
| Quadrant-wise count rates Data is divided into 100 sec bins |
 |
|
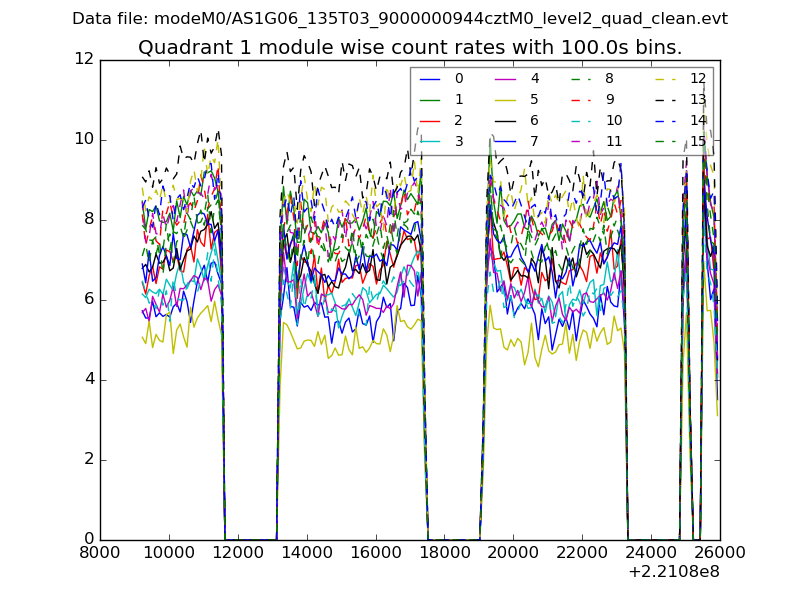
| Module-wise count rates for Quadrant A Data is divided into 100 sec bins |
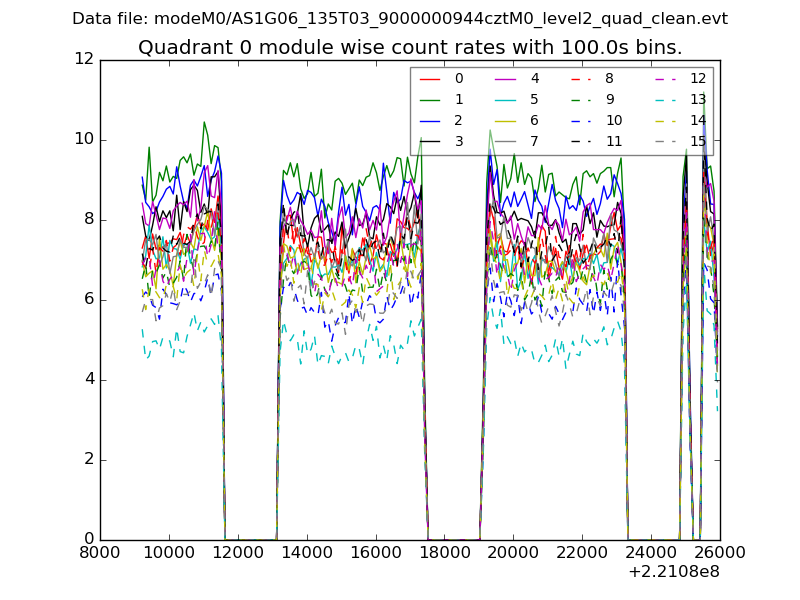 |
 |
| Module-wise count rates for Quadrant B Data is divided into 100 sec bins |
 |
 |
| Module-wise count rates for Quadrant C Data is divided into 100 sec bins |
 |
 |
| Module-wise count rates for Quadrant D Data is divided into 100 sec bins |
 |
 |
| Parameter | Plot |
|---|---|
| CZT HV Monitor |  |
| D_VDD |  |
| Temperature 1 |  |
| Veto HV Monitor |  |
| Veto LLD | 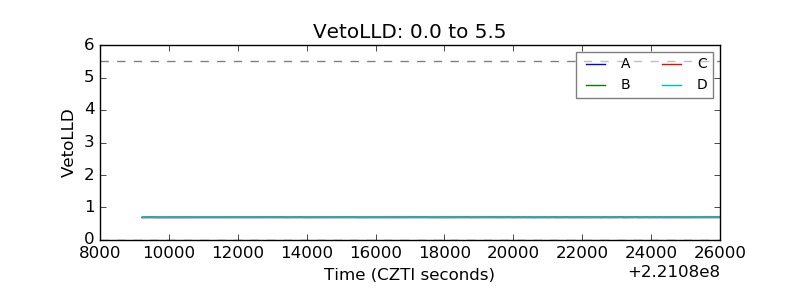 |
| Alpha Counter |  |
| _CPM_Rate |  |
| CZT Counter | 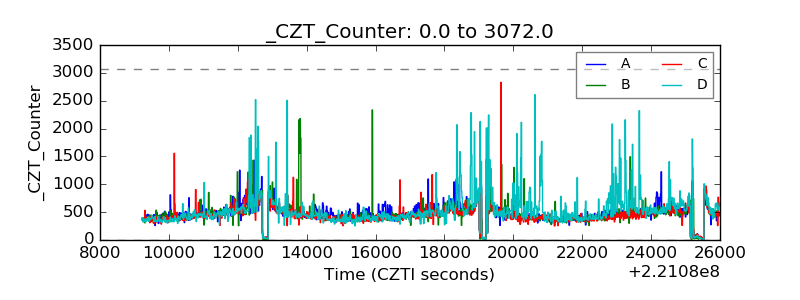 |
| +2.5 Volts monitor | 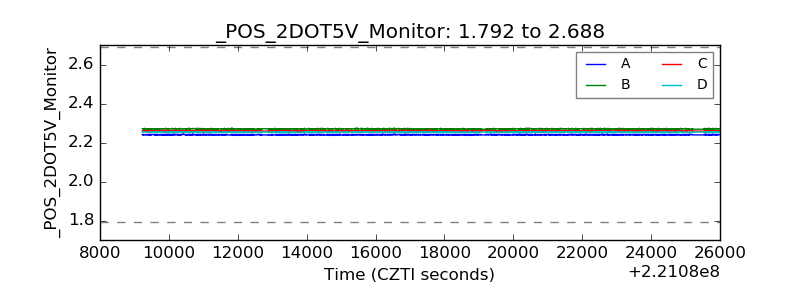 |
| +5 Volts monitor |  |
| _ROLL_ROT |  |
| _Roll_DEC |  |
| _Roll_RA |  |
| Veto Counter |  |