| Param | Original file | Final file |
|---|---|---|
| Filename | modeM0/AS1A02_075T02_9000000940cztM0_level2.evt | modeM0/AS1A02_075T02_9000000940cztM0_level2_quad_clean.evt |
| Size (bytes) | 579,087,360 | 107,124,480 |
| Size | 552.3 MB | 102.2 MB |
| Events in quadrant A | 4,885,007 | 682,392 |
| Events in quadrant B | 4,040,838 | 697,818 |
| Events in quadrant C | 3,857,838 | 689,384 |
| Events in quadrant D | 4,258,799 | 666,238 |
| Mode M0 | |||
|---|---|---|---|
| Quadrant | BADHDUFLAG | Total packets | Discarded packets |
| A | 0 | 19442 | 0 |
| B | 0 | 16873 | 0 |
| C | 0 | 16178 | 0 |
| D | 0 | 17367 | 0 |
| Mode M9 | |||
|---|---|---|---|
| Quadrant | BADHDUFLAG | Total packets | Discarded packets |
| A | 0 | 26 | 0 |
| B | 0 | 26 | 0 |
| C | 0 | 26 | 0 |
| D | 0 | 26 | 0 |
| Mode SS | |||
|---|---|---|---|
| Quadrant | BADHDUFLAG | Total packets | Discarded packets |
| A | 0 | 150 | 0 |
| B | 0 | 150 | 0 |
| C | 0 | 150 | 0 |
| D | 0 | 150 | 0 |
| Quadrant | Total seconds | Saturated seconds | Saturation percentage |
|---|---|---|---|
| A | 7301 | 385 | 5.273250% |
| B | 7301 | 248 | 3.396795% |
| C | 7301 | 198 | 2.711957% |
| D | 7301 | 352 | 4.821257% |
Noise dominated data is calculated using 1-second bins in cleaned event files. If a bin has >2000 counts, and if more than 50% of those come from <1% of pixels, then it is considered to be noise-dominated and hence unusable.
| Quadrant | # 1 sec bins | Bins with >0 counts | Bins with >2000 counts | High rate bins dominated by noise | Noise dominated (total time) | Noise dominated (detector-on time) | Marked lightcurve |
|---|---|---|---|---|---|---|---|
| A | 9891 | 7303 | 134 | 134 | 1.35% | 1.83% |  |
| B | 9891 | 7303 | 45 | 45 | 0.45% | 0.62% |  |
| C | 9891 | 7303 | 59 | 59 | 0.60% | 0.81% |  |
| D | 9891 | 7303 | 125 | 125 | 1.26% | 1.71% |  |
Top three noisy pixels from each quadrant. If the there are fewer than three noisy pixels in the level2.evt file, extra rows are filled as -1
| Pixel properties | Quadrant properties | ||||||
|---|---|---|---|---|---|---|---|
| Quadrant | DetID | PixID | Counts | Sigma | Mean | Median | Sigma |
| A | 8 | 15 | 1228628 | 6616.52 | 923 | 904 | 185.6 |
| A | 13 | 251 | 66827 | 355.27 | 923 | 904 | 185.6 |
| A | 15 | 239 | 17745 | 90.76 | 923 | 904 | 185.6 |
| B | 4 | 48 | 201111 | 1135.99 | 933 | 912 | 176.2 |
| B | 0 | 228 | 142303 | 802.3 | 933 | 912 | 176.2 |
| B | 0 | 214 | 26883 | 147.37 | 933 | 912 | 176.2 |
| C | 9 | 68 | 223194 | 1060.56 | 916 | 922 | 209.6 |
| C | 10 | 22 | 29391 | 135.84 | 916 | 922 | 209.6 |
| C | 12 | 4 | 19140 | 86.93 | 916 | 922 | 209.6 |
| D | 2 | 33 | 493679 | 2231.46 | 906 | 878 | 220.8 |
| D | 8 | 195 | 141663 | 637.49 | 906 | 878 | 220.8 |
| D | 2 | 152 | 73016 | 326.65 | 906 | 878 | 220.8 |
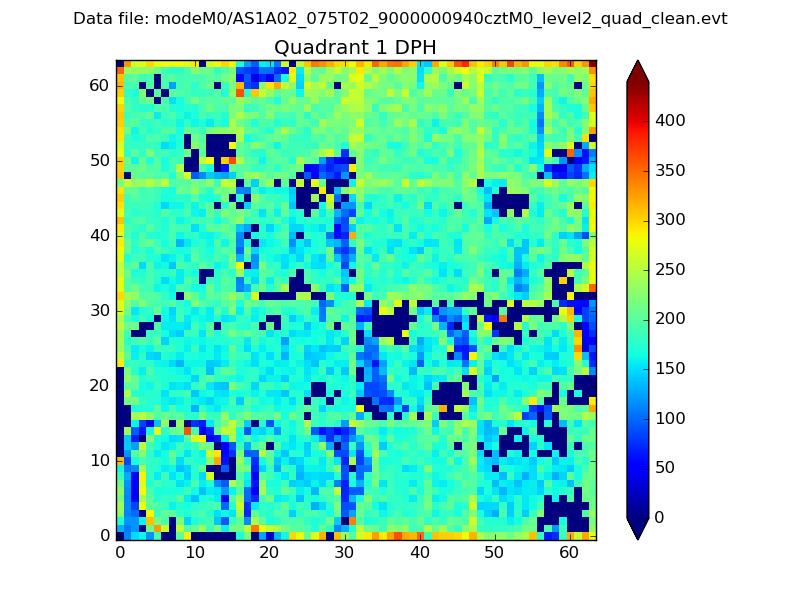
Histogram calculated using DETX and DETY for each event in the final _common_clean file
| Quadrant A |  |
 |
Quadrant B |
|---|---|---|---|
| Quadrant D |  |
 |
Quadrant C |
| Plot type | Count rate plots | Images |
|---|---|---|
| Comparison with Poisson distribution Blue bars denote a histogram of data divided into 1 sec bins. Red curve is a Poisson curve with rate = median count rate of data. |
 |
 |
| Quadrant-wise count rates Data is divided into 100 sec bins |
 |
|
| Module-wise count rates for Quadrant A Data is divided into 100 sec bins |
 |
 |
| Module-wise count rates for Quadrant B Data is divided into 100 sec bins |
 |
 |
| Module-wise count rates for Quadrant C Data is divided into 100 sec bins |
 |
 |
| Module-wise count rates for Quadrant D Data is divided into 100 sec bins |
 |
 |
| Parameter | Plot |
|---|---|
| CZT HV Monitor | 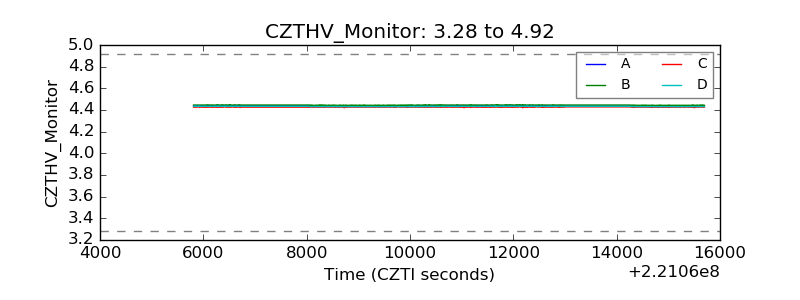 |
| D_VDD |  |
| Temperature 1 |  |
| Veto HV Monitor |  |
| Veto LLD |  |
| Alpha Counter |  |
| _CPM_Rate |  |
| CZT Counter |  |
| +2.5 Volts monitor |  |
| +5 Volts monitor |  |
| _ROLL_ROT |  |
| _Roll_DEC | 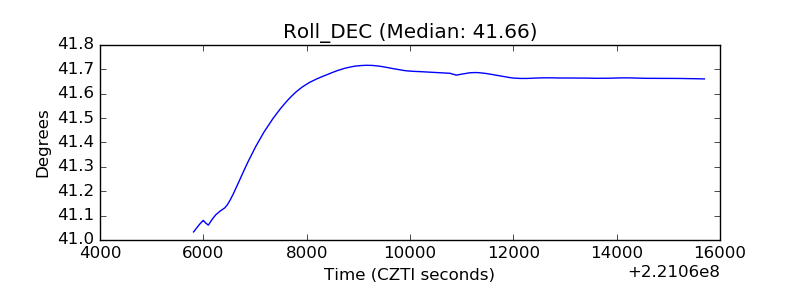 |
| _Roll_RA |  |
| Veto Counter |  |