| Param | Original file | Final file |
|---|---|---|
| Filename | modeM0/AS1A02_174T04_9000000938cztM0_level2.evt | modeM0/AS1A02_174T04_9000000938cztM0_level2_quad_clean.evt |
| Size (bytes) | 8,964,645,120 | 1,468,301,760 |
| Size | 8.3 GB | 1.4 GB |
| Events in quadrant A | 59,598,972 | 9,062,132 |
| Events in quadrant B | 61,926,114 | 9,181,764 |
| Events in quadrant C | 63,652,276 | 9,069,701 |
| Events in quadrant D | 77,976,601 | 8,679,733 |
| Mode M9 | |||
|---|---|---|---|
| Quadrant | BADHDUFLAG | Total packets | Discarded packets |
| A | 0 | 192 | 0 |
| B | 0 | 192 | 0 |
| C | 0 | 192 | 0 |
| D | 0 | 192 | 0 |
| Mode M0 | |||
|---|---|---|---|
| Quadrant | BADHDUFLAG | Total packets | Discarded packets |
| A | 0 | 261065 | 0 |
| B | 0 | 266725 | 0 |
| C | 0 | 271625 | 0 |
| D | 0 | 315712 | 0 |
| Mode SS | |||
|---|---|---|---|
| Quadrant | BADHDUFLAG | Total packets | Discarded packets |
| A | 0 | 2526 | 0 |
| B | 0 | 2526 | 0 |
| C | 0 | 2526 | 0 |
| D | 0 | 2526 | 0 |
| Quadrant | Total seconds | Saturated seconds | Saturation percentage |
|---|---|---|---|
| A | 123725 | 1483 | 1.198626% |
| B | 123729 | 2455 | 1.984175% |
| C | 123731 | 1771 | 1.431331% |
| D | 123728 | 3917 | 3.165815% |
Noise dominated data is calculated using 1-second bins in cleaned event files. If a bin has >2000 counts, and if more than 50% of those come from <1% of pixels, then it is considered to be noise-dominated and hence unusable.
| Quadrant | # 1 sec bins | Bins with >0 counts | Bins with >2000 counts | High rate bins dominated by noise | Noise dominated (total time) | Noise dominated (detector-on time) | Marked lightcurve |
|---|---|---|---|---|---|---|---|
| A | 155948 | 123763 | 113 | 113 | 0.07% | 0.09% |  |
| B | 155948 | 123763 | 666 | 666 | 0.43% | 0.54% |  |
| C | 155948 | 123768 | 715 | 715 | 0.46% | 0.58% |  |
| D | 155948 | 123761 | 2118 | 2118 | 1.36% | 1.71% |  |
Top three noisy pixels from each quadrant. If the there are fewer than three noisy pixels in the level2.evt file, extra rows are filled as -1
| Pixel properties | Quadrant properties | ||||||
|---|---|---|---|---|---|---|---|
| Quadrant | DetID | PixID | Counts | Sigma | Mean | Median | Sigma |
| A | 8 | 15 | 2261171 | 751.31 | 14790 | 14466 | 2990.4 |
| A | 13 | 248 | 204573 | 63.57 | 14790 | 14466 | 2990.4 |
| A | 0 | 226 | 145617 | 43.86 | 14790 | 14466 | 2990.4 |
| B | 0 | 228 | 2455427 | 871.13 | 14863 | 14523 | 2802.0 |
| B | 0 | 219 | 419138 | 144.4 | 14863 | 14523 | 2802.0 |
| B | 15 | 204 | 337742 | 115.35 | 14863 | 14523 | 2802.0 |
| C | 9 | 68 | 3792034 | 1140.19 | 14388 | 14445 | 3313.1 |
| C | 9 | 247 | 1820046 | 544.98 | 14388 | 14445 | 3313.1 |
| C | 12 | 16 | 1055658 | 314.27 | 14388 | 14445 | 3313.1 |
| D | 8 | 195 | 9826898 | 2787.38 | 14292 | 13856 | 3520.5 |
| D | 2 | 33 | 4018177 | 1137.42 | 14292 | 13856 | 3520.5 |
| D | 14 | 34 | 2498825 | 705.85 | 14292 | 13856 | 3520.5 |
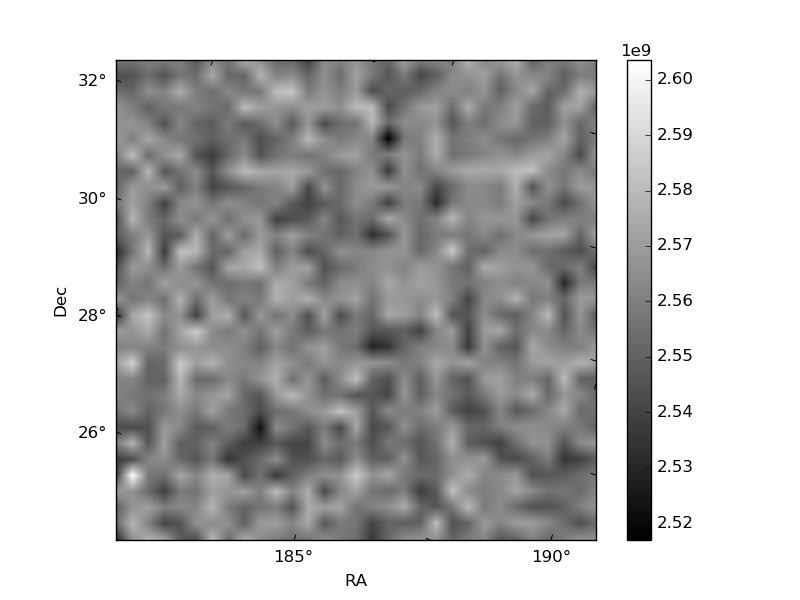
Histogram calculated using DETX and DETY for each event in the final _common_clean file
| Quadrant A | 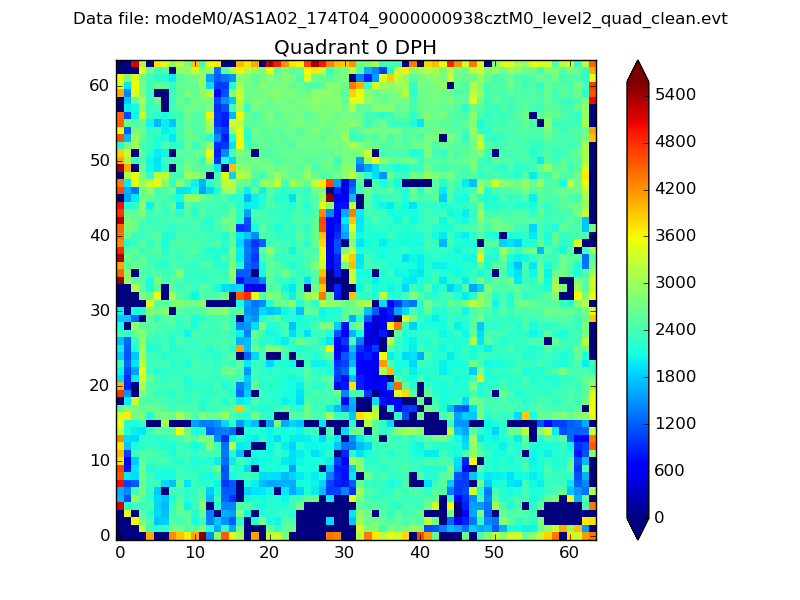 |
 |
Quadrant B |
|---|---|---|---|
| Quadrant D |  |
 |
Quadrant C |
| Plot type | Count rate plots | Images |
|---|---|---|
| Comparison with Poisson distribution Blue bars denote a histogram of data divided into 1 sec bins. Red curve is a Poisson curve with rate = median count rate of data. |
 |
 |
| Quadrant-wise count rates Data is divided into 100 sec bins |
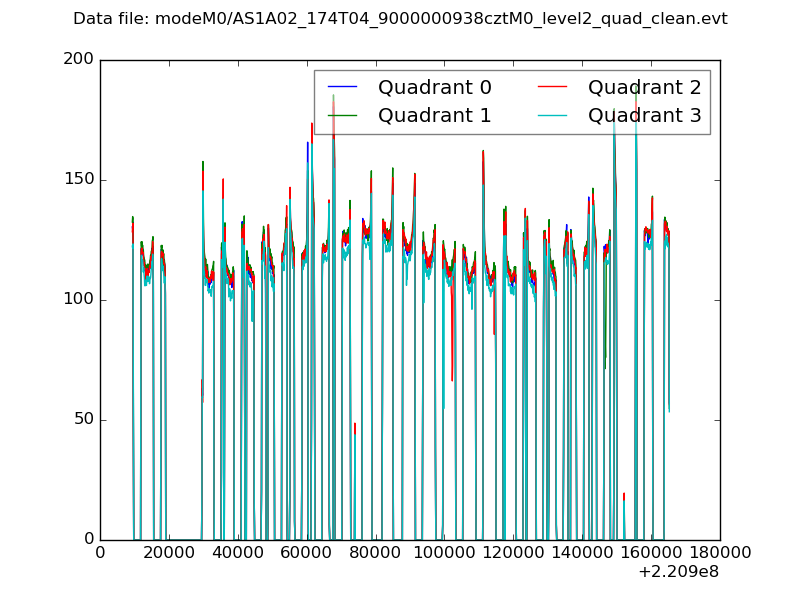 |
|
| Module-wise count rates for Quadrant A Data is divided into 100 sec bins |
 |
 |
| Module-wise count rates for Quadrant B Data is divided into 100 sec bins |
 |
 |
| Module-wise count rates for Quadrant C Data is divided into 100 sec bins |
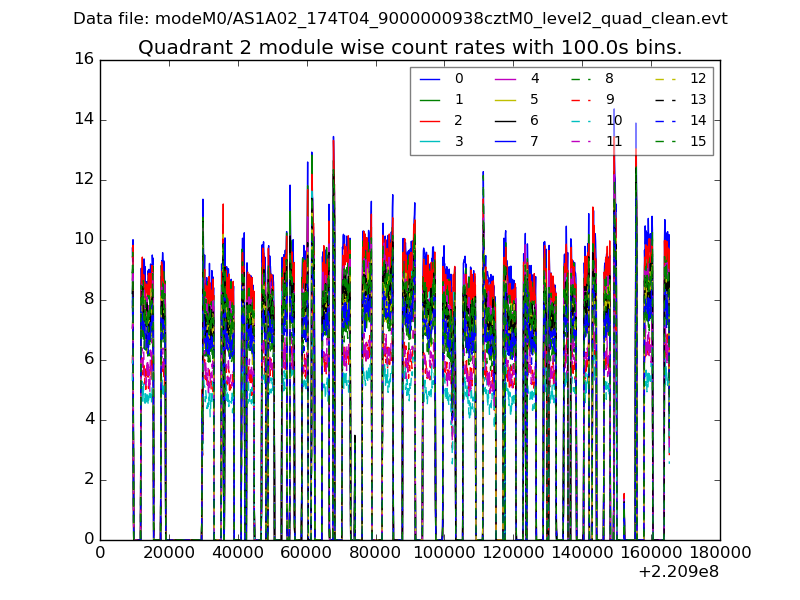 |
 |
| Module-wise count rates for Quadrant D Data is divided into 100 sec bins |
 |
 |
| Parameter | Plot |
|---|---|
| CZT HV Monitor |  |
| D_VDD |  |
| Temperature 1 | 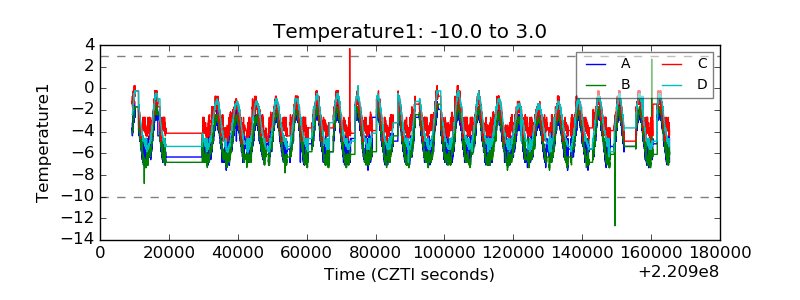 |
| Veto HV Monitor | 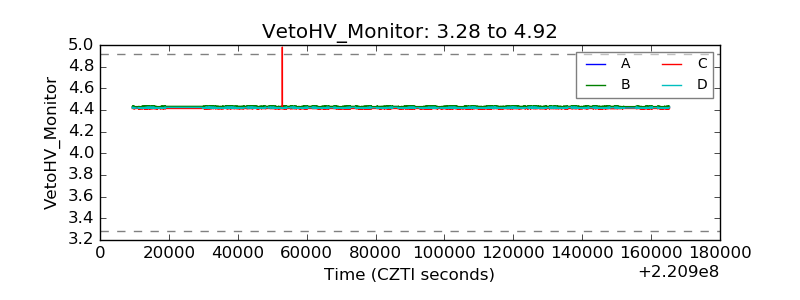 |
| Veto LLD |  |
| Alpha Counter |  |
| _CPM_Rate |  |
| CZT Counter |  |
| +2.5 Volts monitor |  |
| +5 Volts monitor |  |
| _ROLL_ROT | 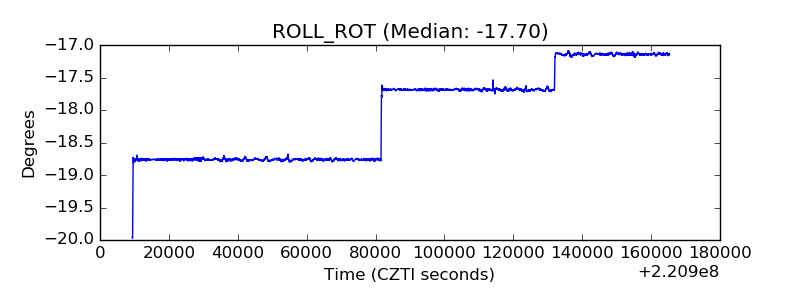 |
| _Roll_DEC | 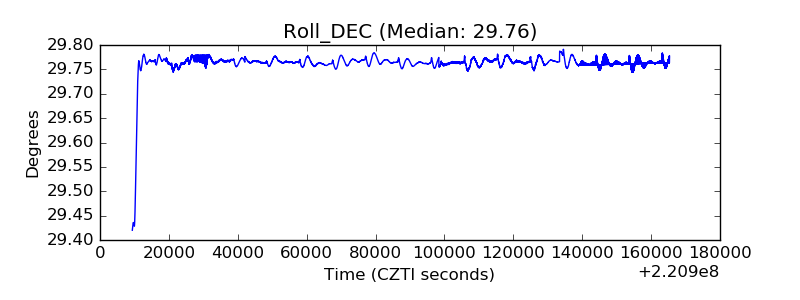 |
| _Roll_RA |  |
| Veto Counter |  |