| Param | Original file | Final file |
|---|---|---|
| Filename | modeM0/AS1G06_086T02_9000000936cztM0_level2.evt | modeM0/AS1G06_086T02_9000000936cztM0_level2_quad_clean.evt |
| Size (bytes) | 16,444,756,800 | 2,853,299,520 |
| Size | 15.3 GB | 2.7 GB |
| Events in quadrant A | 110,422,218 | 17,888,647 |
| Events in quadrant B | 114,840,985 | 18,103,841 |
| Events in quadrant C | 111,149,009 | 17,707,195 |
| Events in quadrant D | 145,949,257 | 16,805,938 |
| Mode M0 | |||
|---|---|---|---|
| Quadrant | BADHDUFLAG | Total packets | Discarded packets |
| A | 0 | 487107 | 0 |
| B | 0 | 497485 | 0 |
| C | 0 | 489058 | 0 |
| D | 0 | 589713 | 0 |
| Mode M9 | |||
|---|---|---|---|
| Quadrant | BADHDUFLAG | Total packets | Discarded packets |
| A | 0 | 377 | 0 |
| B | 0 | 372 | 0 |
| C | 0 | 373 | 0 |
| D | 0 | 371 | 0 |
| Mode SS | |||
|---|---|---|---|
| Quadrant | BADHDUFLAG | Total packets | Discarded packets |
| A | 0 | 4760 | 0 |
| B | 0 | 4764 | 0 |
| C | 0 | 4746 | 0 |
| D | 0 | 4744 | 0 |
| Quadrant | Total seconds | Saturated seconds | Saturation percentage |
|---|---|---|---|
| A | 232360 | 2688 | 1.156826% |
| B | 232398 | 3875 | 1.667398% |
| C | 232375 | 2369 | 1.019473% |
| D | 232302 | 7956 | 3.424852% |
Noise dominated data is calculated using 1-second bins in cleaned event files. If a bin has >2000 counts, and if more than 50% of those come from <1% of pixels, then it is considered to be noise-dominated and hence unusable.
| Quadrant | # 1 sec bins | Bins with >0 counts | Bins with >2000 counts | High rate bins dominated by noise | Noise dominated (total time) | Noise dominated (detector-on time) | Marked lightcurve |
|---|---|---|---|---|---|---|---|
| A | 305391 | 232878 | 307 | 307 | 0.10% | 0.13% |  |
| B | 305391 | 232920 | 729 | 729 | 0.24% | 0.31% |  |
| C | 305391 | 232873 | 595 | 595 | 0.19% | 0.26% | 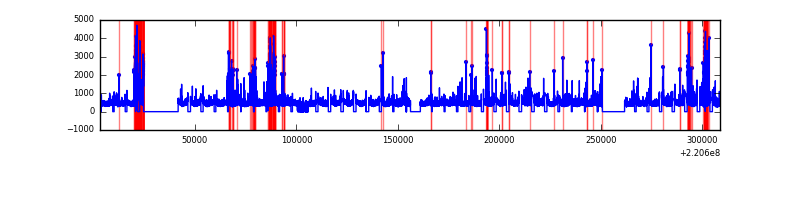 |
| D | 305391 | 232758 | 5351 | 5351 | 1.75% | 2.30% |  |
Top three noisy pixels from each quadrant. If the there are fewer than three noisy pixels in the level2.evt file, extra rows are filled as -1
| Pixel properties | Quadrant properties | ||||||
|---|---|---|---|---|---|---|---|
| Quadrant | DetID | PixID | Counts | Sigma | Mean | Median | Sigma |
| A | 8 | 15 | 1750024 | 309.49 | 27669 | 27088 | 5567.1 |
| A | 13 | 170 | 811368 | 140.88 | 27669 | 27088 | 5567.1 |
| A | 13 | 248 | 634625 | 109.13 | 27669 | 27088 | 5567.1 |
| B | 0 | 228 | 2441368 | 457.45 | 27889 | 27254 | 5277.3 |
| B | 4 | 81 | 2439195 | 457.04 | 27889 | 27254 | 5277.3 |
| B | 12 | 111 | 537554 | 96.7 | 27889 | 27254 | 5277.3 |
| C | 9 | 247 | 4376105 | 699.06 | 26923 | 27057 | 6221.3 |
| C | 12 | 16 | 1409832 | 222.26 | 26923 | 27057 | 6221.3 |
| C | 13 | 61 | 211042 | 29.57 | 26923 | 27057 | 6221.3 |
| D | 8 | 195 | 13877391 | 2130.84 | 26617 | 25803 | 6500.5 |
| D | 2 | 63 | 11359416 | 1743.49 | 26617 | 25803 | 6500.5 |
| D | 12 | 220 | 5697965 | 872.57 | 26617 | 25803 | 6500.5 |
Histogram calculated using DETX and DETY for each event in the final _common_clean file
| Quadrant A | 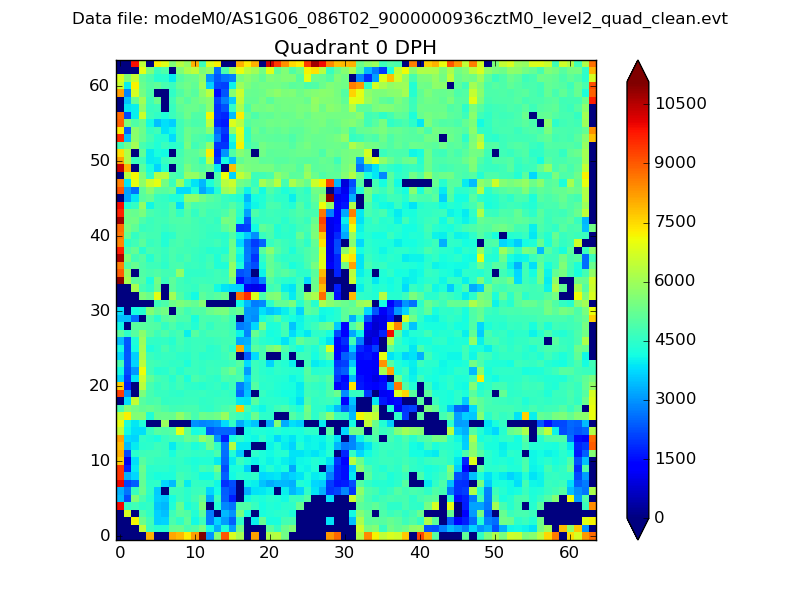 |
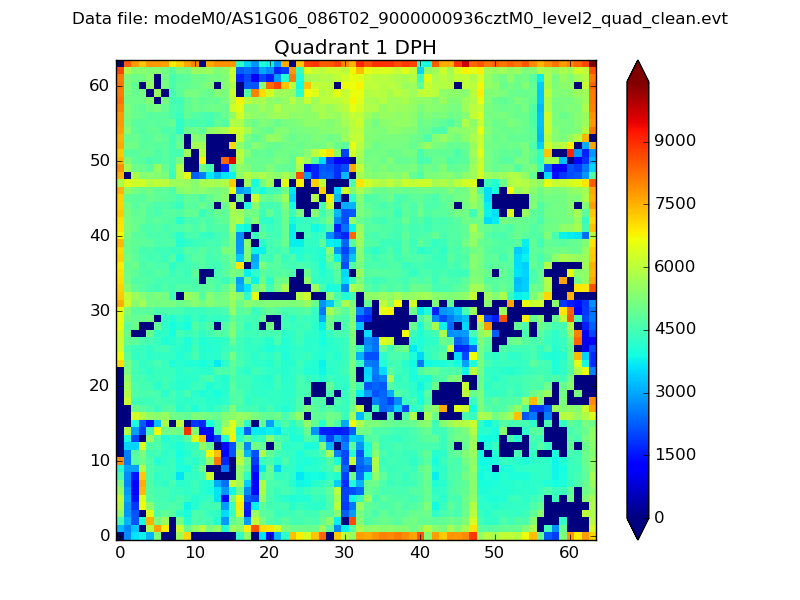 |
Quadrant B |
|---|---|---|---|
| Quadrant D |  |
 |
Quadrant C |
| Plot type | Count rate plots | Images |
|---|---|---|
| Comparison with Poisson distribution Blue bars denote a histogram of data divided into 1 sec bins. Red curve is a Poisson curve with rate = median count rate of data. |
 |
 |
| Quadrant-wise count rates Data is divided into 100 sec bins |
 |
|
| Module-wise count rates for Quadrant A Data is divided into 100 sec bins |
 |
 |
| Module-wise count rates for Quadrant B Data is divided into 100 sec bins |
 |
 |
| Module-wise count rates for Quadrant C Data is divided into 100 sec bins |
 |
 |
| Module-wise count rates for Quadrant D Data is divided into 100 sec bins |
 |
 |
| Parameter | Plot |
|---|---|
| CZT HV Monitor |  |
| D_VDD |  |
| Temperature 1 |  |
| Veto HV Monitor |  |
| Veto LLD |  |
| Alpha Counter |  |
| _CPM_Rate |  |
| CZT Counter |  |
| +2.5 Volts monitor |  |
| +5 Volts monitor |  |
| _ROLL_ROT |  |
| _Roll_DEC | 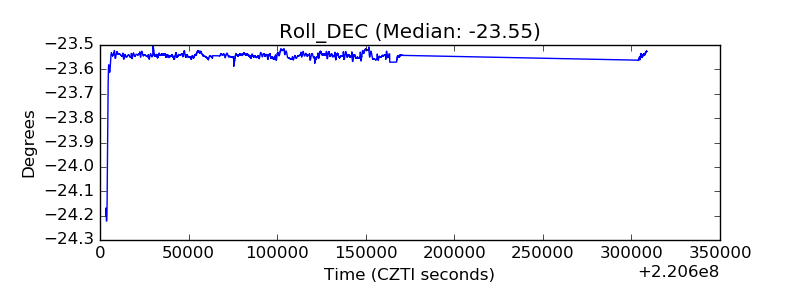 |
| _Roll_RA |  |
| Veto Counter |  |