| Param | Original file | Final file |
|---|---|---|
| Filename | modeM0/AS1G06_168T10_9000000932cztM0_level2.evt | modeM0/AS1G06_168T10_9000000932cztM0_level2_quad_clean.evt |
| Size (bytes) | 3,323,715,840 | 554,019,840 |
| Size | 3.1 GB | 528.4 MB |
| Events in quadrant A | 22,790,832 | 3,456,405 |
| Events in quadrant B | 22,074,318 | 3,536,298 |
| Events in quadrant C | 20,476,806 | 3,482,087 |
| Events in quadrant D | 32,271,151 | 3,206,693 |
| Mode M0 | |||
|---|---|---|---|
| Quadrant | BADHDUFLAG | Total packets | Discarded packets |
| A | 0 | 99205 | 0 |
| B | 0 | 96351 | 0 |
| C | 0 | 92997 | 0 |
| D | 0 | 125162 | 0 |
| Mode SS | |||
|---|---|---|---|
| Quadrant | BADHDUFLAG | Total packets | Discarded packets |
| A | 0 | 918 | 0 |
| B | 0 | 918 | 0 |
| C | 0 | 918 | 0 |
| D | 0 | 918 | 0 |
| Mode M9 | |||
|---|---|---|---|
| Quadrant | BADHDUFLAG | Total packets | Discarded packets |
| A | 0 | 57 | 0 |
| B | 0 | 57 | 0 |
| C | 0 | 57 | 0 |
| D | 0 | 57 | 0 |
| Quadrant | Total seconds | Saturated seconds | Saturation percentage |
|---|---|---|---|
| A | 45136 | 1010 | 2.237682% |
| B | 45136 | 755 | 1.672722% |
| C | 45136 | 317 | 0.702322% |
| D | 45136 | 3650 | 8.086671% |
Noise dominated data is calculated using 1-second bins in cleaned event files. If a bin has >2000 counts, and if more than 50% of those come from <1% of pixels, then it is considered to be noise-dominated and hence unusable.
| Quadrant | # 1 sec bins | Bins with >0 counts | Bins with >2000 counts | High rate bins dominated by noise | Noise dominated (total time) | Noise dominated (detector-on time) | Marked lightcurve |
|---|---|---|---|---|---|---|---|
| A | 50906 | 45144 | 296 | 296 | 0.58% | 0.66% |  |
| B | 50906 | 45144 | 48 | 48 | 0.09% | 0.11% | 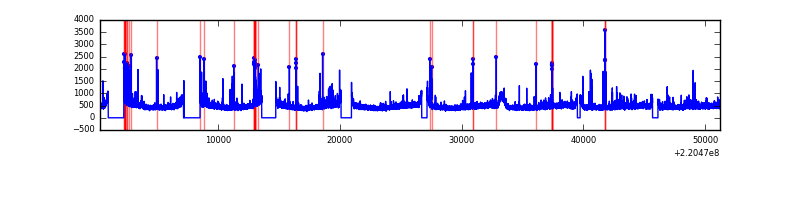 |
| C | 50906 | 45144 | 0 | 0 | 0.00% | 0.00% |  |
| D | 50906 | 45144 | 2768 | 2768 | 5.44% | 6.13% |  |
Top three noisy pixels from each quadrant. If the there are fewer than three noisy pixels in the level2.evt file, extra rows are filled as -1
| Pixel properties | Quadrant properties | ||||||
|---|---|---|---|---|---|---|---|
| Quadrant | DetID | PixID | Counts | Sigma | Mean | Median | Sigma |
| A | 4 | 2 | 1192427 | 1098.26 | 5321 | 5209 | 1081.0 |
| A | 13 | 248 | 341126 | 310.75 | 5321 | 5209 | 1081.0 |
| A | 14 | 111 | 291190 | 264.55 | 5321 | 5209 | 1081.0 |
| B | 0 | 214 | 285623 | 270.94 | 5393 | 5263 | 1034.8 |
| B | 4 | 81 | 281567 | 267.02 | 5393 | 5263 | 1034.8 |
| B | 4 | 48 | 235929 | 222.91 | 5393 | 5263 | 1034.8 |
| C | 9 | 247 | 111331 | 88.02 | 5198 | 5226 | 1205.5 |
| C | 9 | 16 | 40675 | 29.41 | 5198 | 5226 | 1205.5 |
| C | 13 | 61 | 40647 | 29.38 | 5198 | 5226 | 1205.5 |
| D | 2 | 33 | 7433677 | 6044.17 | 5005 | 4851 | 1229.1 |
| D | 8 | 195 | 2644537 | 2147.68 | 5005 | 4851 | 1229.1 |
| D | 14 | 34 | 1583114 | 1284.09 | 5005 | 4851 | 1229.1 |
Histogram calculated using DETX and DETY for each event in the final _common_clean file
| Quadrant A |  |
 |
Quadrant B |
|---|---|---|---|
| Quadrant D |  |
 |
Quadrant C |
| Plot type | Count rate plots | Images |
|---|---|---|
| Comparison with Poisson distribution Blue bars denote a histogram of data divided into 1 sec bins. Red curve is a Poisson curve with rate = median count rate of data. |
 |
 |
| Quadrant-wise count rates Data is divided into 100 sec bins |
 |
|
| Module-wise count rates for Quadrant A Data is divided into 100 sec bins |
 |
 |
| Module-wise count rates for Quadrant B Data is divided into 100 sec bins |
 |
 |
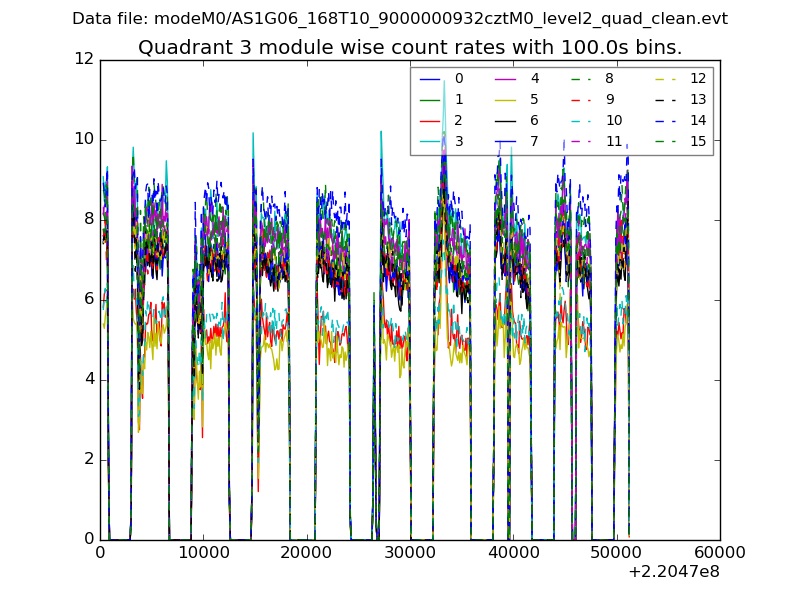
| Module-wise count rates for Quadrant C Data is divided into 100 sec bins |
 |
 |
| Module-wise count rates for Quadrant D Data is divided into 100 sec bins |
 |
 |
| Parameter | Plot |
|---|---|
| CZT HV Monitor |  |
| D_VDD |  |
| Temperature 1 |  |
| Veto HV Monitor |  |
| Veto LLD |  |
| Alpha Counter |  |
| _CPM_Rate |  |
| CZT Counter |  |
| +2.5 Volts monitor |  |
| +5 Volts monitor |  |
| _ROLL_ROT |  |
| _Roll_DEC |  |
| _Roll_RA |  |
| Veto Counter |  |