| Param | Original file | Final file |
|---|---|---|
| Filename | modeM0/AS1G06_087T01_9000000926cztM0_level2.evt | modeM0/AS1G06_087T01_9000000926cztM0_level2_quad_clean.evt |
| Size (bytes) | 1,631,496,960 | 284,719,680 |
| Size | 1.5 GB | 271.5 MB |
| Events in quadrant A | 12,272,206 | 1,773,739 |
| Events in quadrant B | 9,845,234 | 1,854,399 |
| Events in quadrant C | 9,749,684 | 1,840,023 |
| Events in quadrant D | 16,099,331 | 1,683,442 |
| Mode M9 | |||
|---|---|---|---|
| Quadrant | BADHDUFLAG | Total packets | Discarded packets |
| A | 0 | 16 | 0 |
| B | 0 | 16 | 0 |
| C | 0 | 16 | 0 |
| D | 0 | 16 | 0 |
| Mode SS | |||
|---|---|---|---|
| Quadrant | BADHDUFLAG | Total packets | Discarded packets |
| A | 0 | 438 | 0 |
| B | 0 | 438 | 0 |
| C | 0 | 438 | 0 |
| D | 0 | 438 | 0 |
| Mode M0 | |||
|---|---|---|---|
| Quadrant | BADHDUFLAG | Total packets | Discarded packets |
| A | 0 | 51672 | 0 |
| B | 0 | 44134 | 0 |
| C | 0 | 44390 | 0 |
| D | 0 | 61616 | 0 |
| Quadrant | Total seconds | Saturated seconds | Saturation percentage |
|---|---|---|---|
| A | 21353 | 1470 | 6.884279% |
| B | 21353 | 405 | 1.896689% |
| C | 21353 | 395 | 1.849857% |
| D | 21353 | 1794 | 8.401630% |
Noise dominated data is calculated using 1-second bins in cleaned event files. If a bin has >2000 counts, and if more than 50% of those come from <1% of pixels, then it is considered to be noise-dominated and hence unusable.
| Quadrant | # 1 sec bins | Bins with >0 counts | Bins with >2000 counts | High rate bins dominated by noise | Noise dominated (total time) | Noise dominated (detector-on time) | Marked lightcurve |
|---|---|---|---|---|---|---|---|
| A | 22843 | 21356 | 744 | 744 | 3.26% | 3.48% |  |
| B | 22843 | 21356 | 19 | 19 | 0.08% | 0.09% |  |
| C | 22843 | 21356 | 3 | 3 | 0.01% | 0.01% |  |
| D | 22843 | 21356 | 1481 | 1481 | 6.48% | 6.93% | 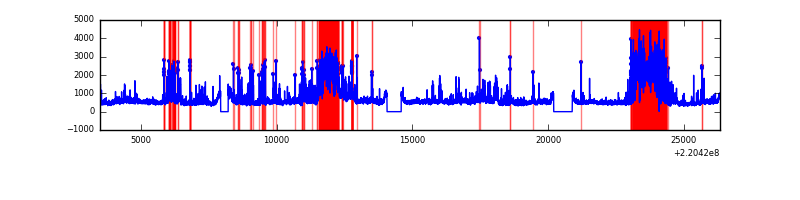 |
Top three noisy pixels from each quadrant. If the there are fewer than three noisy pixels in the level2.evt file, extra rows are filled as -1
| Pixel properties | Quadrant properties | ||||||
|---|---|---|---|---|---|---|---|
| Quadrant | DetID | PixID | Counts | Sigma | Mean | Median | Sigma |
| A | 14 | 111 | 3045032 | 6354.74 | 2341 | 2290 | 478.8 |
| A | 8 | 15 | 186691 | 385.12 | 2341 | 2290 | 478.8 |
| A | 15 | 234 | 26119 | 49.77 | 2341 | 2290 | 478.8 |
| B | 4 | 81 | 130715 | 277.8 | 2429 | 2368 | 462.0 |
| B | 0 | 214 | 117567 | 249.35 | 2429 | 2368 | 462.0 |
| B | 10 | 252 | 67071 | 140.05 | 2429 | 2368 | 462.0 |
| C | 9 | 16 | 514564 | 945.22 | 2343 | 2349 | 541.9 |
| C | 9 | 247 | 45083 | 78.86 | 2343 | 2349 | 541.9 |
| C | 13 | 61 | 18170 | 29.2 | 2343 | 2349 | 541.9 |
| D | 2 | 33 | 3610226 | 6479.6 | 2281 | 2208 | 556.8 |
| D | 8 | 195 | 1716203 | 3078.15 | 2281 | 2208 | 556.8 |
| D | 2 | 152 | 922573 | 1652.87 | 2281 | 2208 | 556.8 |
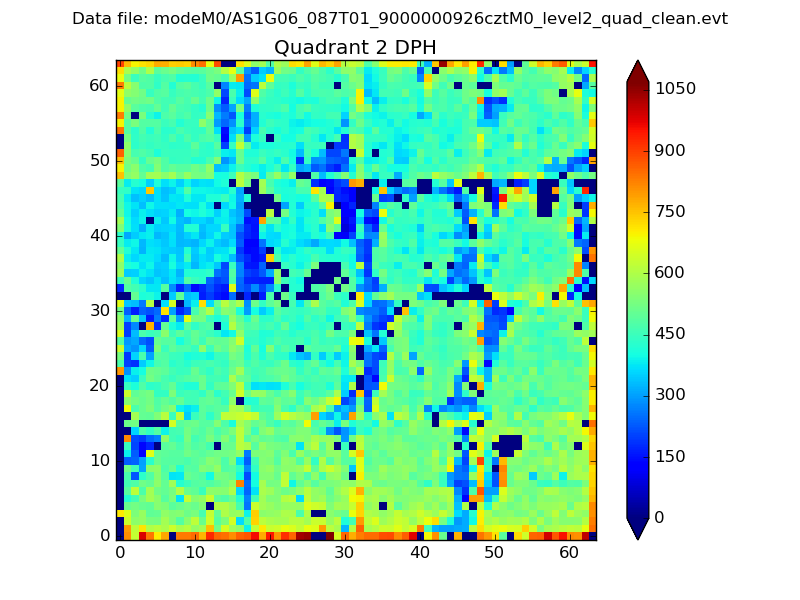
Histogram calculated using DETX and DETY for each event in the final _common_clean file
| Quadrant A |  |
 |
Quadrant B |
|---|---|---|---|
| Quadrant D |  |
 |
Quadrant C |
| Plot type | Count rate plots | Images |
|---|---|---|
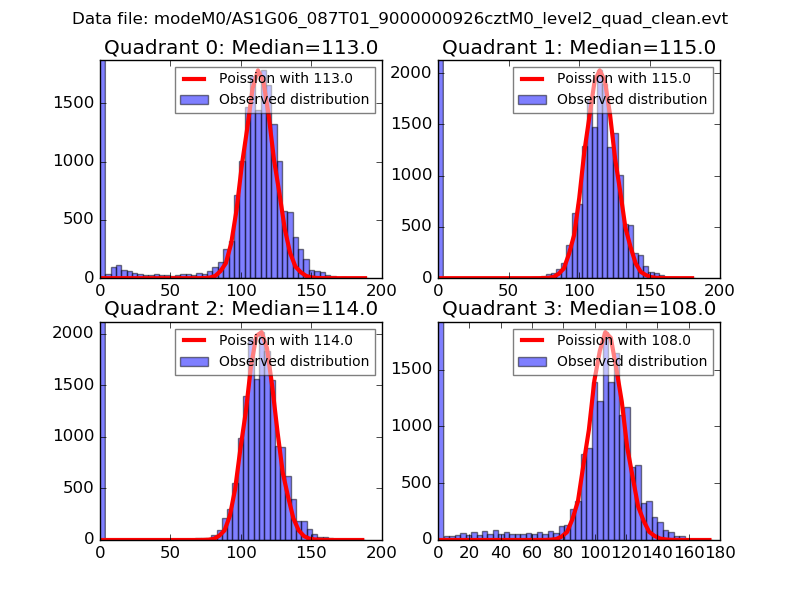
| Comparison with Poisson distribution Blue bars denote a histogram of data divided into 1 sec bins. Red curve is a Poisson curve with rate = median count rate of data. |
 |
 |
| Quadrant-wise count rates Data is divided into 100 sec bins |
 |
|
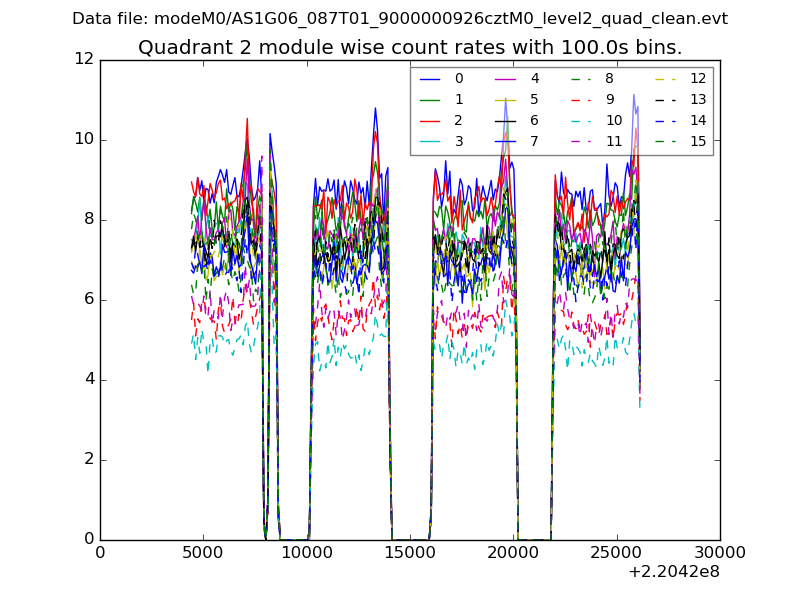
| Module-wise count rates for Quadrant A Data is divided into 100 sec bins |
 |
 |
| Module-wise count rates for Quadrant B Data is divided into 100 sec bins |
 |
 |
| Module-wise count rates for Quadrant C Data is divided into 100 sec bins |
 |
 |
| Module-wise count rates for Quadrant D Data is divided into 100 sec bins |
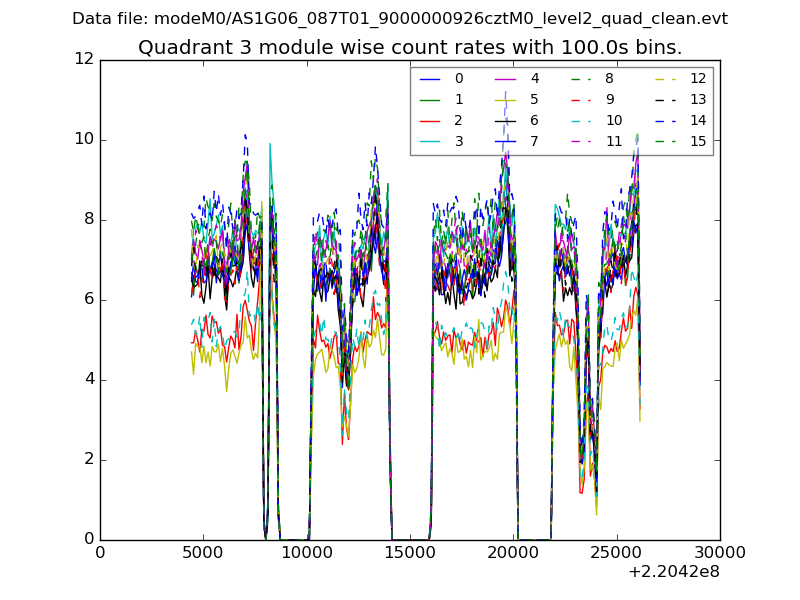 |
 |
| Parameter | Plot |
|---|---|
| CZT HV Monitor | 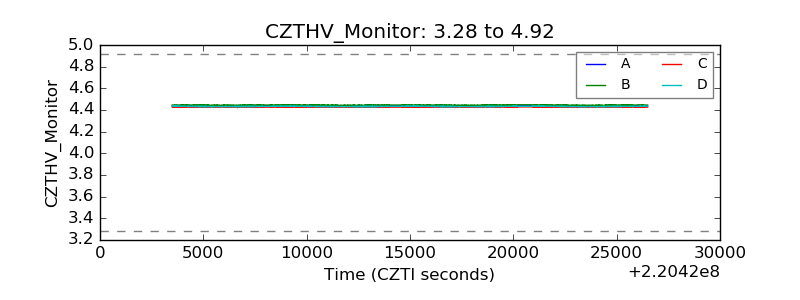 |
| D_VDD |  |
| Temperature 1 |  |
| Veto HV Monitor |  |
| Veto LLD | 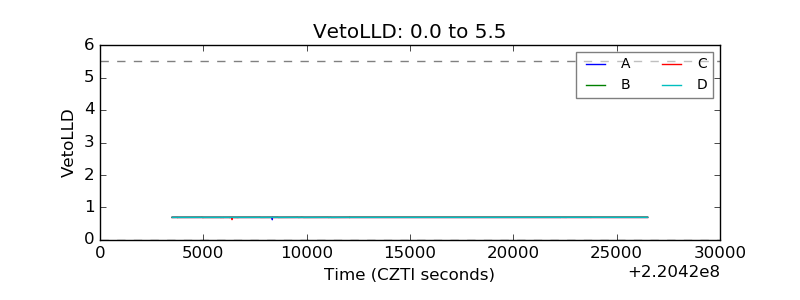 |
| Alpha Counter |  |
| _CPM_Rate |  |
| CZT Counter | 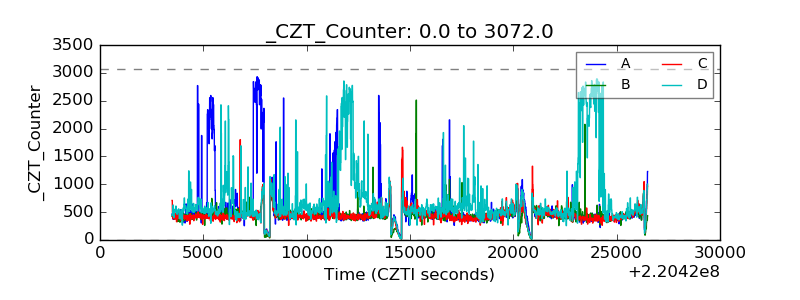 |
| +2.5 Volts monitor |  |
| +5 Volts monitor |  |
| _ROLL_ROT |  |
| _Roll_DEC |  |
| _Roll_RA |  |
| Veto Counter | 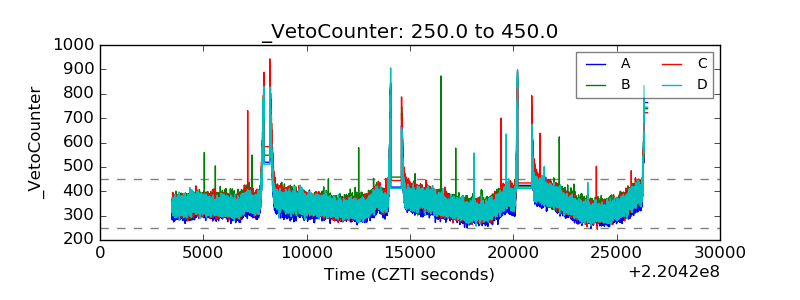 |