| Param | Original file | Final file |
|---|---|---|
| Filename | modeM0/AS1G06_068T01_9000000930cztM0_level2.evt | modeM0/AS1G06_068T01_9000000930cztM0_level2_quad_clean.evt |
| Size (bytes) | 719,821,440 | 139,216,320 |
| Size | 686.5 MB | 132.8 MB |
| Events in quadrant A | 4,962,261 | 905,595 |
| Events in quadrant B | 4,686,420 | 913,607 |
| Events in quadrant C | 4,448,642 | 895,566 |
| Events in quadrant D | 7,059,600 | 843,738 |
| Mode M0 | |||
|---|---|---|---|
| Quadrant | BADHDUFLAG | Total packets | Discarded packets |
| A | 0 | 21158 | 0 |
| B | 0 | 20437 | 0 |
| C | 0 | 19746 | 0 |
| D | 0 | 27569 | 0 |
| Mode M9 | |||
|---|---|---|---|
| Quadrant | BADHDUFLAG | Total packets | Discarded packets |
| A | 0 | 24 | 0 |
| B | 0 | 24 | 0 |
| C | 0 | 24 | 0 |
| D | 0 | 24 | 0 |
| Mode SS | |||
|---|---|---|---|
| Quadrant | BADHDUFLAG | Total packets | Discarded packets |
| A | 0 | 194 | 0 |
| B | 0 | 194 | 0 |
| C | 0 | 194 | 0 |
| D | 0 | 194 | 0 |
| Quadrant | Total seconds | Saturated seconds | Saturation percentage |
|---|---|---|---|
| A | 9488 | 164 | 1.728499% |
| B | 9488 | 107 | 1.127740% |
| C | 9488 | 70 | 0.737774% |
| D | 9488 | 823 | 8.674115% |
Noise dominated data is calculated using 1-second bins in cleaned event files. If a bin has >2000 counts, and if more than 50% of those come from <1% of pixels, then it is considered to be noise-dominated and hence unusable.
| Quadrant | # 1 sec bins | Bins with >0 counts | Bins with >2000 counts | High rate bins dominated by noise | Noise dominated (total time) | Noise dominated (detector-on time) | Marked lightcurve |
|---|---|---|---|---|---|---|---|
| A | 11888 | 9490 | 23 | 23 | 0.19% | 0.24% |  |
| B | 11888 | 9490 | 0 | 0 | 0.00% | 0.00% | 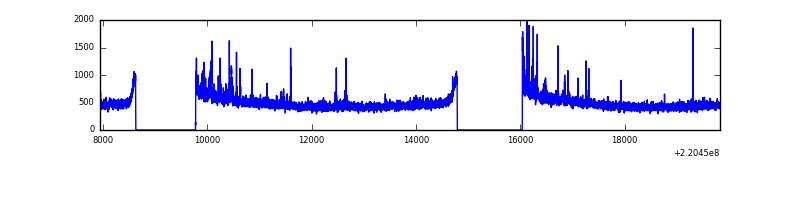 |
| C | 11888 | 9490 | 0 | 0 | 0.00% | 0.00% |  |
| D | 11888 | 9490 | 627 | 627 | 5.27% | 6.61% |  |
Top three noisy pixels from each quadrant. If the there are fewer than three noisy pixels in the level2.evt file, extra rows are filled as -1
| Pixel properties | Quadrant properties | ||||||
|---|---|---|---|---|---|---|---|
| Quadrant | DetID | PixID | Counts | Sigma | Mean | Median | Sigma |
| A | 15 | 234 | 286639 | 1235.24 | 1149 | 1125 | 231.1 |
| A | 4 | 2 | 108476 | 464.44 | 1149 | 1125 | 231.1 |
| A | 13 | 251 | 91217 | 389.77 | 1149 | 1125 | 231.1 |
| B | 0 | 214 | 47991 | 212.53 | 1162 | 1136 | 220.5 |
| B | 4 | 48 | 40890 | 180.32 | 1162 | 1136 | 220.5 |
| B | 4 | 81 | 23990 | 103.66 | 1162 | 1136 | 220.5 |
| C | 9 | 247 | 32533 | 121.0 | 1123 | 1133 | 259.5 |
| C | 12 | 4 | 19227 | 69.72 | 1123 | 1133 | 259.5 |
| C | 9 | 16 | 12665 | 44.44 | 1123 | 1133 | 259.5 |
| D | 2 | 33 | 2053583 | 7825.41 | 1082 | 1051 | 262.3 |
| D | 8 | 195 | 406391 | 1545.38 | 1082 | 1051 | 262.3 |
| D | 2 | 152 | 168030 | 636.62 | 1082 | 1051 | 262.3 |
Histogram calculated using DETX and DETY for each event in the final _common_clean file
| Quadrant A |  |
 |
Quadrant B |
|---|---|---|---|
| Quadrant D | 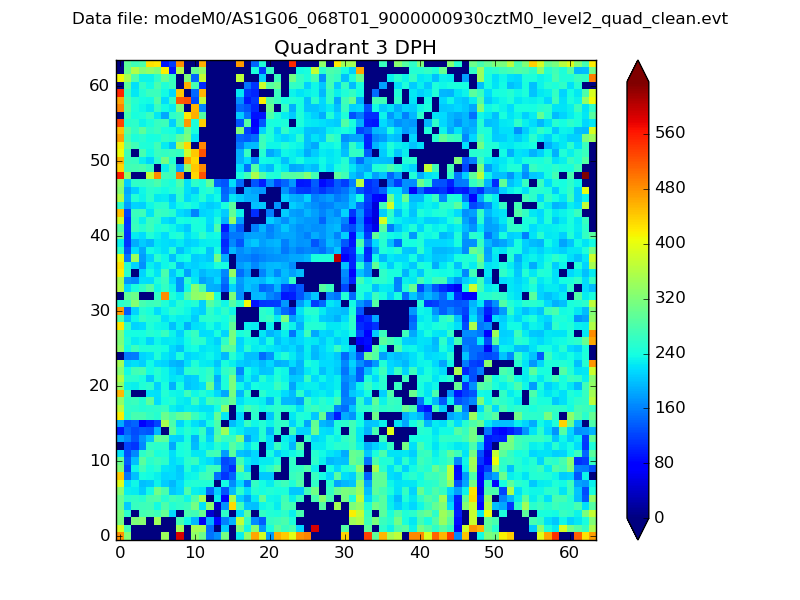 |
 |
Quadrant C |
| Plot type | Count rate plots | Images |
|---|---|---|
| Comparison with Poisson distribution Blue bars denote a histogram of data divided into 1 sec bins. Red curve is a Poisson curve with rate = median count rate of data. |
 |
 |
| Quadrant-wise count rates Data is divided into 100 sec bins |
 |
|
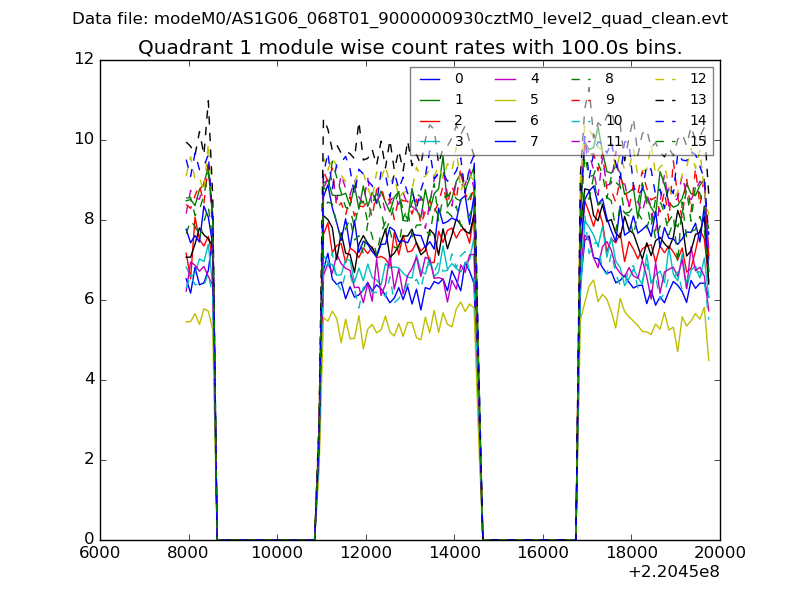
| Module-wise count rates for Quadrant A Data is divided into 100 sec bins |
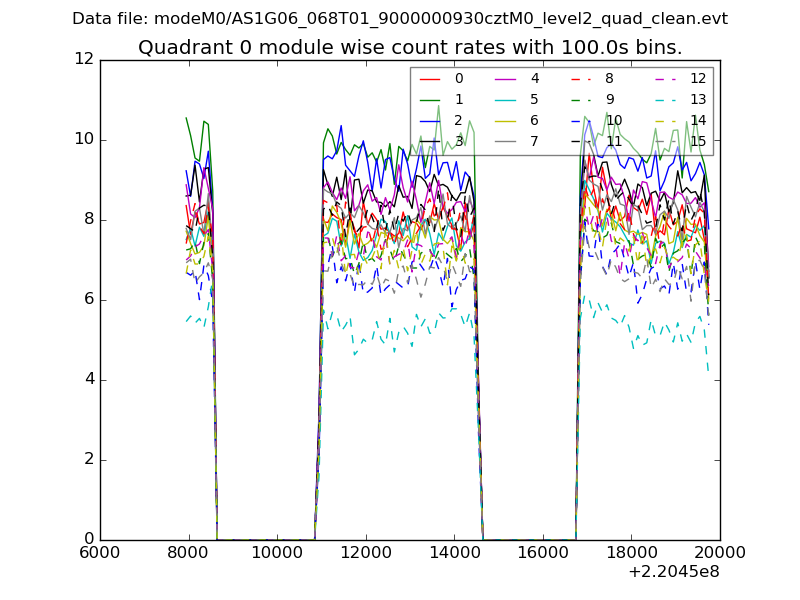 |
 |
| Module-wise count rates for Quadrant B Data is divided into 100 sec bins |
 |
 |
| Module-wise count rates for Quadrant C Data is divided into 100 sec bins |
 |
 |
| Module-wise count rates for Quadrant D Data is divided into 100 sec bins |
 |
 |
| Parameter | Plot |
|---|---|
| CZT HV Monitor | 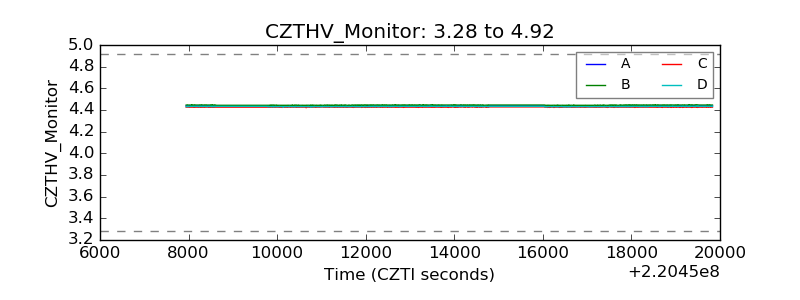 |
| D_VDD |  |
| Temperature 1 | 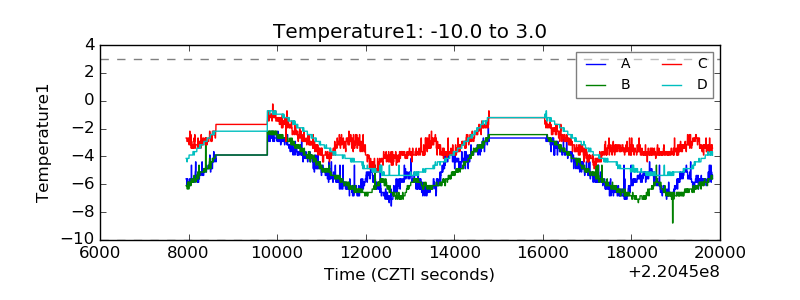 |
| Veto HV Monitor |  |
| Veto LLD | 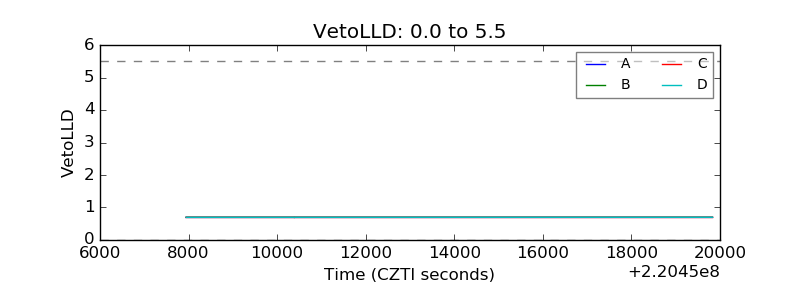 |
| Alpha Counter |  |
| _CPM_Rate | 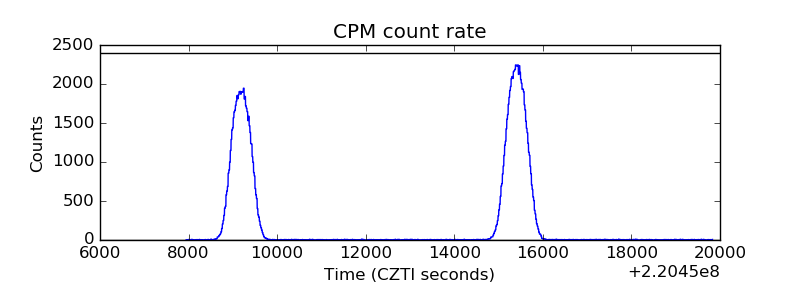 |
| CZT Counter |  |
| +2.5 Volts monitor |  |
| +5 Volts monitor |  |
| _ROLL_ROT |  |
| _Roll_DEC |  |
| _Roll_RA |  |
| Veto Counter |  |