| Param | Original file | Final file |
|---|---|---|
| Filename | modeM0/AS1G06_066T01_9000000928cztM0_level2.evt | modeM0/AS1G06_066T01_9000000928cztM0_level2_quad_clean.evt |
| Size (bytes) | 612,017,280 | 109,739,520 |
| Size | 583.7 MB | 104.7 MB |
| Events in quadrant A | 4,111,528 | 708,138 |
| Events in quadrant B | 3,855,486 | 718,299 |
| Events in quadrant C | 3,595,170 | 702,042 |
| Events in quadrant D | 6,441,060 | 649,452 |
| Mode M0 | |||
|---|---|---|---|
| Quadrant | BADHDUFLAG | Total packets | Discarded packets |
| A | 0 | 17513 | 0 |
| B | 0 | 16624 | 0 |
| C | 0 | 16029 | 0 |
| D | 0 | 24308 | 0 |
| Mode SS | |||
|---|---|---|---|
| Quadrant | BADHDUFLAG | Total packets | Discarded packets |
| A | 0 | 156 | 0 |
| B | 0 | 156 | 0 |
| C | 0 | 156 | 0 |
| D | 0 | 156 | 0 |
| Mode M9 | |||
|---|---|---|---|
| Quadrant | BADHDUFLAG | Total packets | Discarded packets |
| A | 0 | 11 | 0 |
| B | 0 | 11 | 0 |
| C | 0 | 11 | 0 |
| D | 0 | 11 | 0 |
| Quadrant | Total seconds | Saturated seconds | Saturation percentage |
|---|---|---|---|
| A | 7855 | 172 | 2.189688% |
| B | 7855 | 106 | 1.349459% |
| C | 7855 | 56 | 0.712922% |
| D | 7855 | 493 | 6.276257% |
Noise dominated data is calculated using 1-second bins in cleaned event files. If a bin has >2000 counts, and if more than 50% of those come from <1% of pixels, then it is considered to be noise-dominated and hence unusable.
| Quadrant | # 1 sec bins | Bins with >0 counts | Bins with >2000 counts | High rate bins dominated by noise | Noise dominated (total time) | Noise dominated (detector-on time) | Marked lightcurve |
|---|---|---|---|---|---|---|---|
| A | 8865 | 7856 | 44 | 44 | 0.50% | 0.56% |  |
| B | 8865 | 7856 | 23 | 23 | 0.26% | 0.29% |  |
| C | 8865 | 7856 | 0 | 0 | 0.00% | 0.00% |  |
| D | 8865 | 7856 | 451 | 451 | 5.09% | 5.74% |  |
Top three noisy pixels from each quadrant. If the there are fewer than three noisy pixels in the level2.evt file, extra rows are filled as -1
| Pixel properties | Quadrant properties | ||||||
|---|---|---|---|---|---|---|---|
| Quadrant | DetID | PixID | Counts | Sigma | Mean | Median | Sigma |
| A | 14 | 111 | 519140 | 2809.63 | 911 | 890 | 184.5 |
| A | 8 | 15 | 39286 | 208.16 | 911 | 890 | 184.5 |
| A | 15 | 236 | 18367 | 94.75 | 911 | 890 | 184.5 |
| B | 0 | 214 | 73534 | 417.0 | 913 | 892 | 174.2 |
| B | 3 | 220 | 64185 | 363.33 | 913 | 892 | 174.2 |
| B | 4 | 48 | 56818 | 321.04 | 913 | 892 | 174.2 |
| C | 9 | 16 | 97894 | 475.84 | 878 | 881 | 203.9 |
| C | 9 | 247 | 62364 | 301.57 | 878 | 881 | 203.9 |
| C | 13 | 61 | 6870 | 29.38 | 878 | 881 | 203.9 |
| D | 2 | 33 | 1174815 | 5520.64 | 871 | 845 | 212.7 |
| D | 2 | 152 | 523639 | 2458.46 | 871 | 845 | 212.7 |
| D | 8 | 195 | 459961 | 2159.01 | 871 | 845 | 212.7 |
Histogram calculated using DETX and DETY for each event in the final _common_clean file
| Quadrant A |  |
 |
Quadrant B |
|---|---|---|---|
| Quadrant D |  |
 |
Quadrant C |
| Plot type | Count rate plots | Images |
|---|---|---|
| Comparison with Poisson distribution Blue bars denote a histogram of data divided into 1 sec bins. Red curve is a Poisson curve with rate = median count rate of data. |
 |
 |
| Quadrant-wise count rates Data is divided into 100 sec bins |
 |
|
| Module-wise count rates for Quadrant A Data is divided into 100 sec bins |
 |
 |
| Module-wise count rates for Quadrant B Data is divided into 100 sec bins |
 |
 |
| Module-wise count rates for Quadrant C Data is divided into 100 sec bins |
 |
 |
| Module-wise count rates for Quadrant D Data is divided into 100 sec bins |
 |
 |
| Parameter | Plot |
|---|---|
| CZT HV Monitor |  |
| D_VDD |  |
| Temperature 1 |  |
| Veto HV Monitor | 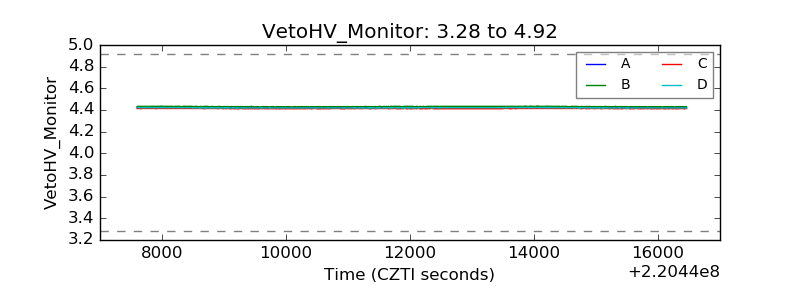 |
| Veto LLD |  |
| Alpha Counter |  |
| _CPM_Rate |  |
| CZT Counter |  |
| +2.5 Volts monitor |  |
| +5 Volts monitor |  |
| _ROLL_ROT |  |
| _Roll_DEC |  |
| _Roll_RA |  |
| Veto Counter |  |