| Param | Original file | Final file |
|---|---|---|
| Filename | modeM0/AS1G06_164T01_9000000922cztM0_level2.evt | modeM0/AS1G06_164T01_9000000922cztM0_level2_quad_clean.evt |
| Size (bytes) | 1,117,002,240 | 199,097,280 |
| Size | 1.0 GB | 189.9 MB |
| Events in quadrant A | 8,544,505 | 1,271,612 |
| Events in quadrant B | 7,033,896 | 1,284,198 |
| Events in quadrant C | 6,628,932 | 1,269,953 |
| Events in quadrant D | 10,621,124 | 1,183,816 |
| Mode M9 | |||
|---|---|---|---|
| Quadrant | BADHDUFLAG | Total packets | Discarded packets |
| A | 0 | 28 | 0 |
| B | 0 | 28 | 0 |
| C | 0 | 28 | 0 |
| D | 0 | 28 | 0 |
| Mode SS | |||
|---|---|---|---|
| Quadrant | BADHDUFLAG | Total packets | Discarded packets |
| A | 0 | 300 | 0 |
| B | 0 | 300 | 0 |
| C | 0 | 300 | 0 |
| D | 0 | 300 | 0 |
| Mode M0 | |||
|---|---|---|---|
| Quadrant | BADHDUFLAG | Total packets | Discarded packets |
| A | 0 | 35560 | 0 |
| B | 0 | 31145 | 0 |
| C | 0 | 30352 | 0 |
| D | 0 | 42276 | 0 |
| Quadrant | Total seconds | Saturated seconds | Saturation percentage |
|---|---|---|---|
| A | 14786 | 752 | 5.085892% |
| B | 14786 | 216 | 1.460841% |
| C | 14786 | 155 | 1.048289% |
| D | 14785 | 1653 | 11.180250% |
Noise dominated data is calculated using 1-second bins in cleaned event files. If a bin has >2000 counts, and if more than 50% of those come from <1% of pixels, then it is considered to be noise-dominated and hence unusable.
| Quadrant | # 1 sec bins | Bins with >0 counts | Bins with >2000 counts | High rate bins dominated by noise | Noise dominated (total time) | Noise dominated (detector-on time) | Marked lightcurve |
|---|---|---|---|---|---|---|---|
| A | 28402 | 14790 | 245 | 245 | 0.86% | 1.66% |  |
| B | 28402 | 14790 | 12 | 12 | 0.04% | 0.08% | 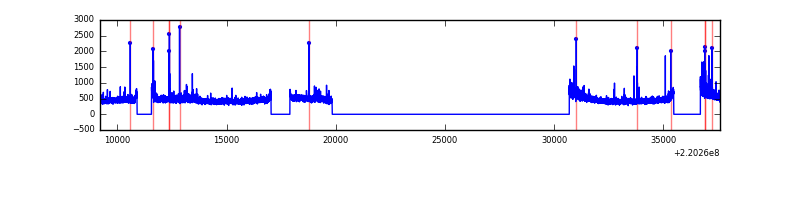 |
| C | 28402 | 14790 | 4 | 4 | 0.01% | 0.03% |  |
| D | 28402 | 14789 | 1255 | 1255 | 4.42% | 8.49% |  |
Top three noisy pixels from each quadrant. If the there are fewer than three noisy pixels in the level2.evt file, extra rows are filled as -1
| Pixel properties | Quadrant properties | ||||||
|---|---|---|---|---|---|---|---|
| Quadrant | DetID | PixID | Counts | Sigma | Mean | Median | Sigma |
| A | 14 | 111 | 1285865 | 3773.35 | 1698 | 1663 | 340.3 |
| A | 4 | 2 | 272957 | 797.14 | 1698 | 1663 | 340.3 |
| A | 13 | 251 | 231874 | 676.43 | 1698 | 1663 | 340.3 |
| B | 0 | 214 | 116572 | 350.5 | 1738 | 1694 | 327.8 |
| B | 4 | 81 | 50497 | 148.9 | 1738 | 1694 | 327.8 |
| B | 12 | 111 | 32144 | 92.91 | 1738 | 1694 | 327.8 |
| C | 9 | 247 | 46609 | 116.15 | 1685 | 1695 | 386.7 |
| C | 13 | 61 | 13481 | 30.48 | 1685 | 1695 | 386.7 |
| C | 12 | 4 | 8106 | 16.58 | 1685 | 1695 | 386.7 |
| D | 2 | 33 | 3836047 | 9993.3 | 1587 | 1536 | 383.7 |
| D | 8 | 195 | 275971 | 715.22 | 1587 | 1536 | 383.7 |
| D | 2 | 63 | 189251 | 489.21 | 1587 | 1536 | 383.7 |
Histogram calculated using DETX and DETY for each event in the final _common_clean file
| Quadrant A | 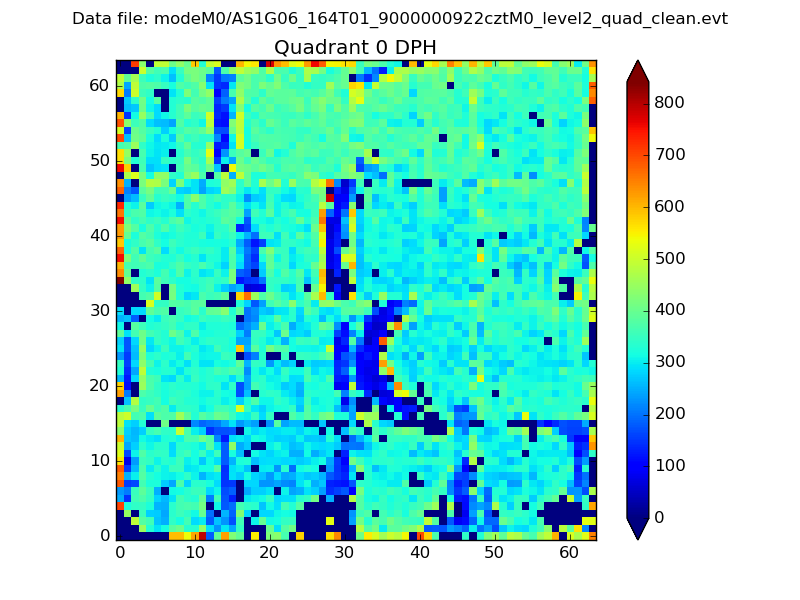 |
 |
Quadrant B |
|---|---|---|---|
| Quadrant D |  |
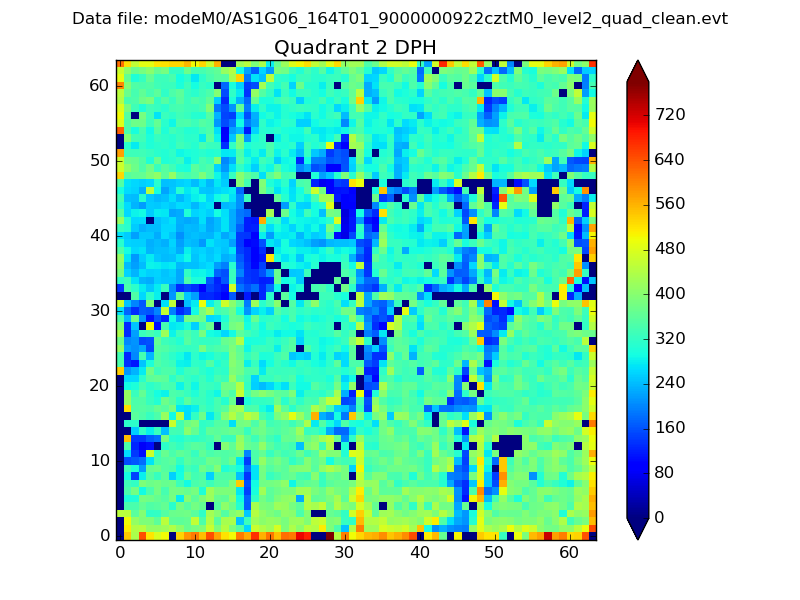 |
Quadrant C |
| Plot type | Count rate plots | Images |
|---|---|---|
| Comparison with Poisson distribution Blue bars denote a histogram of data divided into 1 sec bins. Red curve is a Poisson curve with rate = median count rate of data. |
 |
 |
| Quadrant-wise count rates Data is divided into 100 sec bins |
 |
|
| Module-wise count rates for Quadrant A Data is divided into 100 sec bins |
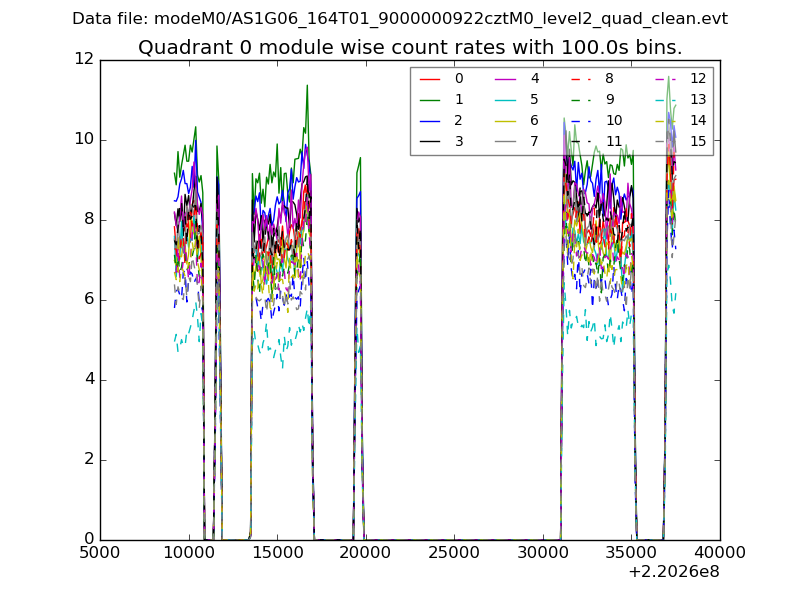 |
 |
| Module-wise count rates for Quadrant B Data is divided into 100 sec bins |
 |
 |
| Module-wise count rates for Quadrant C Data is divided into 100 sec bins |
 |
 |
| Module-wise count rates for Quadrant D Data is divided into 100 sec bins |
 |
 |
| Parameter | Plot |
|---|---|
| CZT HV Monitor |  |
| D_VDD | 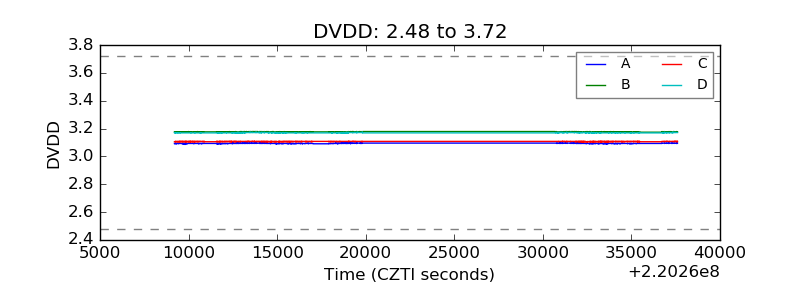 |
| Temperature 1 | 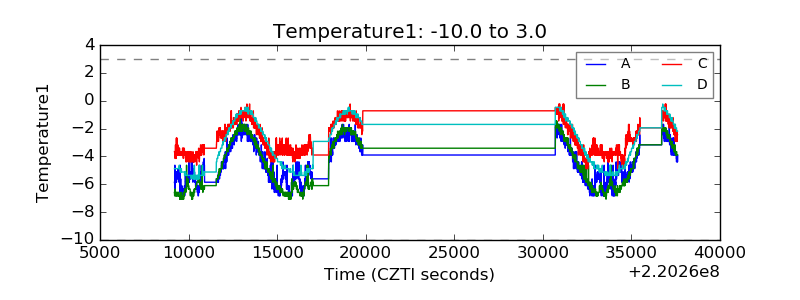 |
| Veto HV Monitor |  |
| Veto LLD | 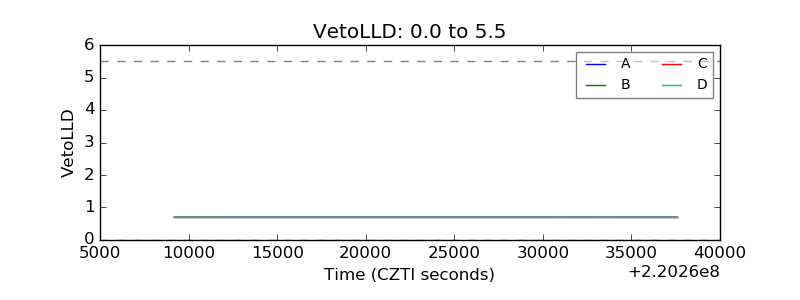 |
| Alpha Counter |  |
| _CPM_Rate |  |
| CZT Counter |  |
| +2.5 Volts monitor |  |
| +5 Volts monitor |  |
| _ROLL_ROT |  |
| _Roll_DEC |  |
| _Roll_RA |  |
| Veto Counter |  |