| Param | Original file | Final file |
|---|---|---|
| Filename | modeM0/AS1C02_003T01_9000000924cztM0_level2.evt | modeM0/AS1C02_003T01_9000000924cztM0_level2_quad_clean.evt |
| Size (bytes) | 7,124,014,080 | 1,333,725,120 |
| Size | 6.6 GB | 1.2 GB |
| Events in quadrant A | 50,200,028 | 8,459,525 |
| Events in quadrant B | 48,384,584 | 8,594,753 |
| Events in quadrant C | 47,354,403 | 8,364,813 |
| Events in quadrant D | 62,788,092 | 7,844,613 |
| Mode SS | |||
|---|---|---|---|
| Quadrant | BADHDUFLAG | Total packets | Discarded packets |
| A | 0 | 2126 | 0 |
| B | 0 | 2126 | 0 |
| C | 0 | 2126 | 0 |
| D | 0 | 2126 | 0 |
| Mode M9 | |||
|---|---|---|---|
| Quadrant | BADHDUFLAG | Total packets | Discarded packets |
| A | 0 | 155 | 0 |
| B | 0 | 155 | 0 |
| C | 0 | 155 | 0 |
| D | 0 | 156 | 0 |
| Mode M0 | |||
|---|---|---|---|
| Quadrant | BADHDUFLAG | Total packets | Discarded packets |
| A | 0 | 221993 | 0 |
| B | 0 | 216211 | 0 |
| C | 0 | 215455 | 0 |
| D | 0 | 257100 | 0 |
| Quadrant | Total seconds | Saturated seconds | Saturation percentage |
|---|---|---|---|
| A | 104071 | 1702 | 1.635422% |
| B | 104072 | 1490 | 1.431701% |
| C | 104072 | 1179 | 1.132870% |
| D | 104071 | 4678 | 4.495008% |
Noise dominated data is calculated using 1-second bins in cleaned event files. If a bin has >2000 counts, and if more than 50% of those come from <1% of pixels, then it is considered to be noise-dominated and hence unusable.
| Quadrant | # 1 sec bins | Bins with >0 counts | Bins with >2000 counts | High rate bins dominated by noise | Noise dominated (total time) | Noise dominated (detector-on time) | Marked lightcurve |
|---|---|---|---|---|---|---|---|
| A | 123974 | 104094 | 287 | 287 | 0.23% | 0.28% | 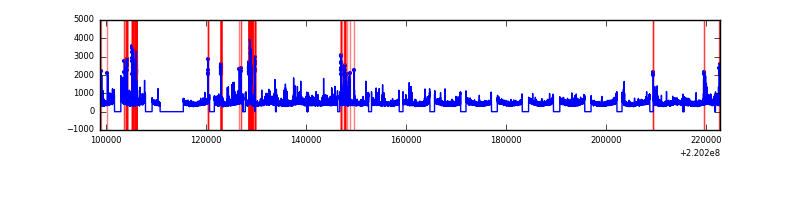 |
| B | 123975 | 104095 | 90 | 90 | 0.07% | 0.09% | 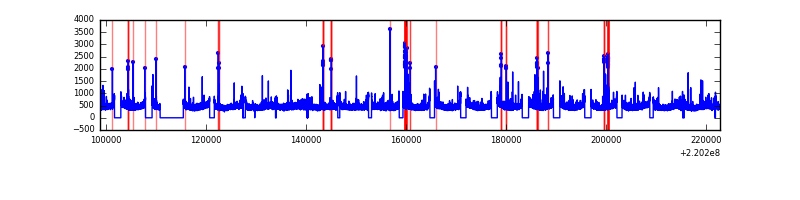 |
| C | 123975 | 104096 | 105 | 105 | 0.08% | 0.10% | 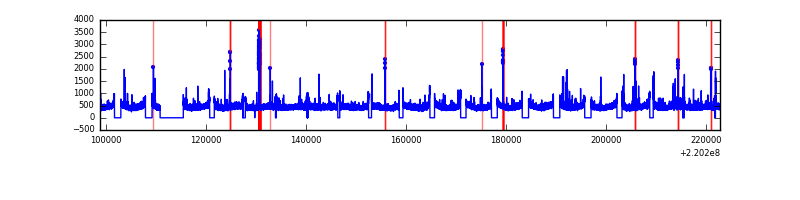 |
| D | 123975 | 104096 | 3203 | 3203 | 2.58% | 3.08% |  |
Top three noisy pixels from each quadrant. If the there are fewer than three noisy pixels in the level2.evt file, extra rows are filled as -1
| Pixel properties | Quadrant properties | ||||||
|---|---|---|---|---|---|---|---|
| Quadrant | DetID | PixID | Counts | Sigma | Mean | Median | Sigma |
| A | 14 | 111 | 2531481 | 1037.5 | 12073 | 11815 | 2428.6 |
| A | 8 | 15 | 796343 | 323.04 | 12073 | 11815 | 2428.6 |
| A | 13 | 251 | 333302 | 132.38 | 12073 | 11815 | 2428.6 |
| B | 10 | 252 | 466703 | 196.58 | 12237 | 11938 | 2313.3 |
| B | 4 | 81 | 356956 | 149.14 | 12237 | 11938 | 2313.3 |
| B | 12 | 111 | 242720 | 99.76 | 12237 | 11938 | 2313.3 |
| C | 12 | 16 | 375816 | 133.81 | 11831 | 11890 | 2719.7 |
| C | 12 | 4 | 325459 | 115.29 | 11831 | 11890 | 2719.7 |
| C | 9 | 16 | 156616 | 53.21 | 11831 | 11890 | 2719.7 |
| D | 2 | 33 | 8973094 | 3219.91 | 11520 | 11176 | 2783.3 |
| D | 8 | 195 | 6072704 | 2177.83 | 11520 | 11176 | 2783.3 |
| D | 2 | 136 | 1010372 | 359.0 | 11520 | 11176 | 2783.3 |
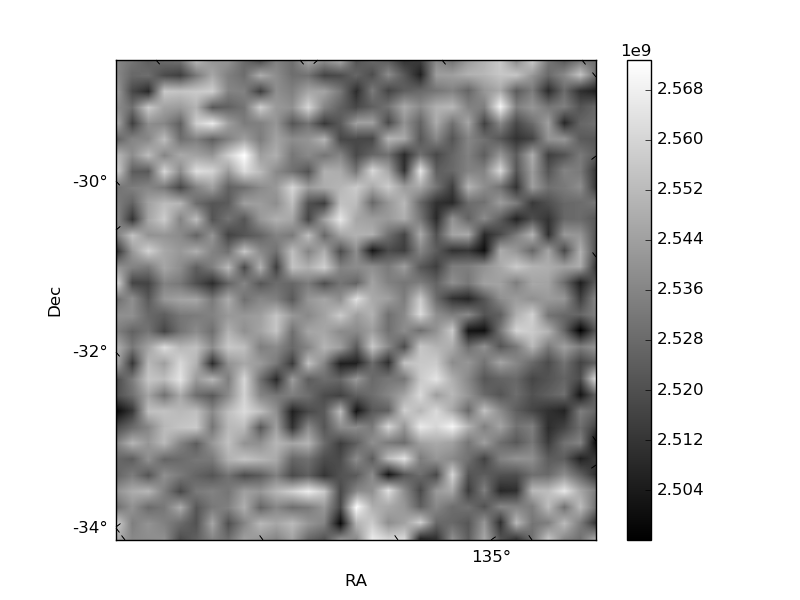
Histogram calculated using DETX and DETY for each event in the final _common_clean file
| Quadrant A |  |
 |
Quadrant B |
|---|---|---|---|
| Quadrant D |  |
 |
Quadrant C |
| Plot type | Count rate plots | Images |
|---|---|---|
| Comparison with Poisson distribution Blue bars denote a histogram of data divided into 1 sec bins. Red curve is a Poisson curve with rate = median count rate of data. |
 |
 |
| Quadrant-wise count rates Data is divided into 100 sec bins |
 |
|
| Module-wise count rates for Quadrant A Data is divided into 100 sec bins |
 |
 |
| Module-wise count rates for Quadrant B Data is divided into 100 sec bins |
 |
 |
| Module-wise count rates for Quadrant C Data is divided into 100 sec bins |
 |
 |
| Module-wise count rates for Quadrant D Data is divided into 100 sec bins |
 |
 |
| Parameter | Plot |
|---|---|
| CZT HV Monitor |  |
| D_VDD |  |
| Temperature 1 |  |
| Veto HV Monitor |  |
| Veto LLD |  |
| Alpha Counter |  |
| _CPM_Rate | 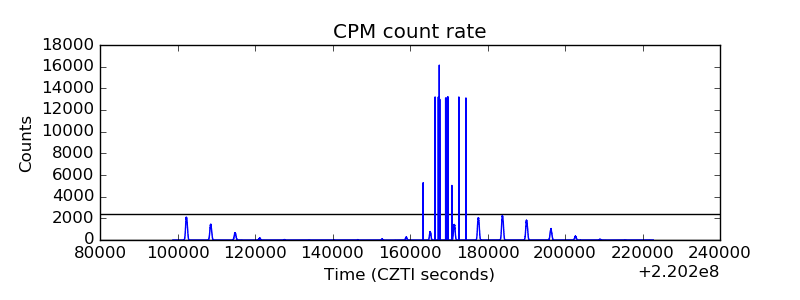 |
| CZT Counter |  |
| +2.5 Volts monitor |  |
| +5 Volts monitor | 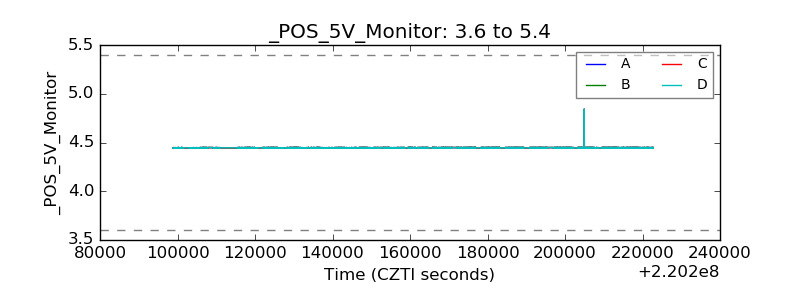 |
| _ROLL_ROT |  |
| _Roll_DEC | 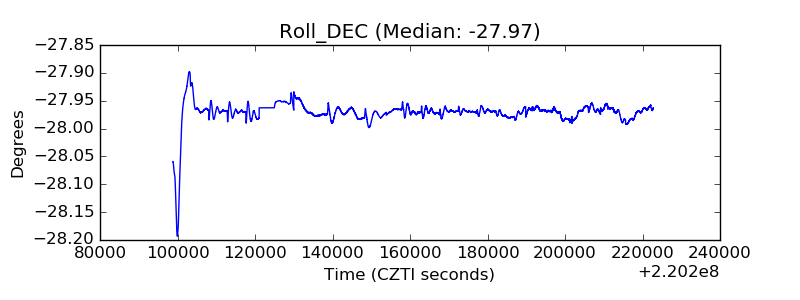 |
| _Roll_RA |  |
| Veto Counter |  |