| Param | Original file | Final file |
|---|---|---|
| Filename | modeM0/AS1G06_135T02_9000000918cztM0_level2.evt | modeM0/AS1G06_135T02_9000000918cztM0_level2_quad_clean.evt |
| Size (bytes) | 2,199,841,920 | 301,726,080 |
| Size | 2.0 GB | 287.7 MB |
| Events in quadrant A | 17,498,948 | 1,790,611 |
| Events in quadrant B | 12,470,750 | 1,935,405 |
| Events in quadrant C | 11,551,203 | 1,915,111 |
| Events in quadrant D | 23,315,100 | 1,675,591 |
| Mode M9 | |||
|---|---|---|---|
| Quadrant | BADHDUFLAG | Total packets | Discarded packets |
| A | 0 | 21 | 0 |
| B | 0 | 21 | 0 |
| C | 0 | 21 | 0 |
| D | 0 | 21 | 0 |
| Mode SS | |||
|---|---|---|---|
| Quadrant | BADHDUFLAG | Total packets | Discarded packets |
| A | 0 | 540 | 0 |
| B | 0 | 540 | 0 |
| C | 0 | 540 | 0 |
| D | 0 | 540 | 0 |
| Mode M0 | |||
|---|---|---|---|
| Quadrant | BADHDUFLAG | Total packets | Discarded packets |
| A | 0 | 70961 | 0 |
| B | 0 | 55823 | 0 |
| C | 0 | 54277 | 0 |
| D | 0 | 88217 | 0 |
| Quadrant | Total seconds | Saturated seconds | Saturation percentage |
|---|---|---|---|
| A | 26458 | 2396 | 9.055862% |
| B | 26458 | 456 | 1.723486% |
| C | 26458 | 205 | 0.774813% |
| D | 26458 | 4597 | 17.374707% |
Noise dominated data is calculated using 1-second bins in cleaned event files. If a bin has >2000 counts, and if more than 50% of those come from <1% of pixels, then it is considered to be noise-dominated and hence unusable.
| Quadrant | # 1 sec bins | Bins with >0 counts | Bins with >2000 counts | High rate bins dominated by noise | Noise dominated (total time) | Noise dominated (detector-on time) | Marked lightcurve |
|---|---|---|---|---|---|---|---|
| A | 28568 | 26463 | 1524 | 1524 | 5.33% | 5.76% |  |
| B | 28568 | 26463 | 32 | 32 | 0.11% | 0.12% | 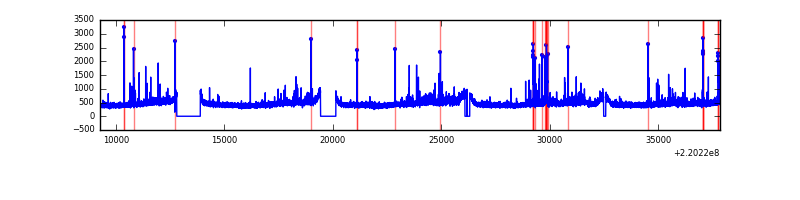 |
| C | 28568 | 26463 | 5 | 5 | 0.02% | 0.02% | 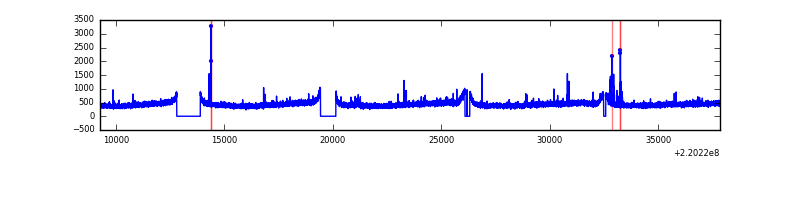 |
| D | 28568 | 26463 | 3344 | 3344 | 11.71% | 12.64% | 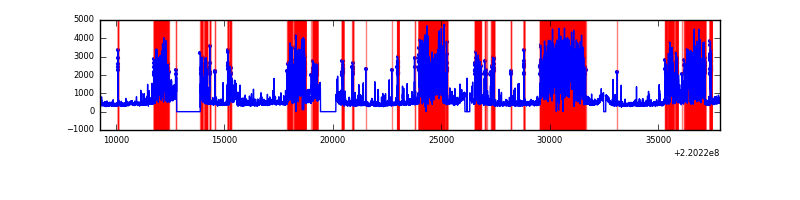 |
Top three noisy pixels from each quadrant. If the there are fewer than three noisy pixels in the level2.evt file, extra rows are filled as -1
| Pixel properties | Quadrant properties | ||||||
|---|---|---|---|---|---|---|---|
| Quadrant | DetID | PixID | Counts | Sigma | Mean | Median | Sigma |
| A | 14 | 111 | 5624524 | 9703.05 | 2868 | 2800 | 579.4 |
| A | 14 | 207 | 302976 | 518.1 | 2868 | 2800 | 579.4 |
| A | 8 | 15 | 300666 | 514.11 | 2868 | 2800 | 579.4 |
| B | 11 | 51 | 185788 | 315.3 | 3035 | 2963 | 579.9 |
| B | 0 | 228 | 159148 | 269.35 | 3035 | 2963 | 579.9 |
| B | 0 | 214 | 151042 | 255.37 | 3035 | 2963 | 579.9 |
| C | 9 | 247 | 99345 | 143.34 | 2919 | 2929 | 672.7 |
| C | 13 | 61 | 23212 | 30.15 | 2919 | 2929 | 672.7 |
| C | 12 | 4 | 22820 | 29.57 | 2919 | 2929 | 672.7 |
| D | 2 | 33 | 10929526 | 16674.9 | 2664 | 2574 | 655.3 |
| D | 8 | 195 | 1095947 | 1668.52 | 2664 | 2574 | 655.3 |
| D | 1 | 239 | 359175 | 544.19 | 2664 | 2574 | 655.3 |
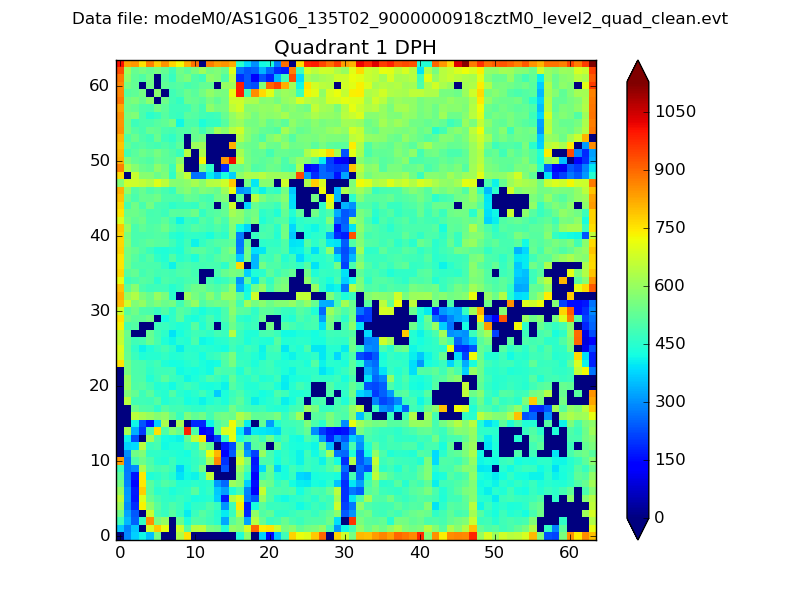
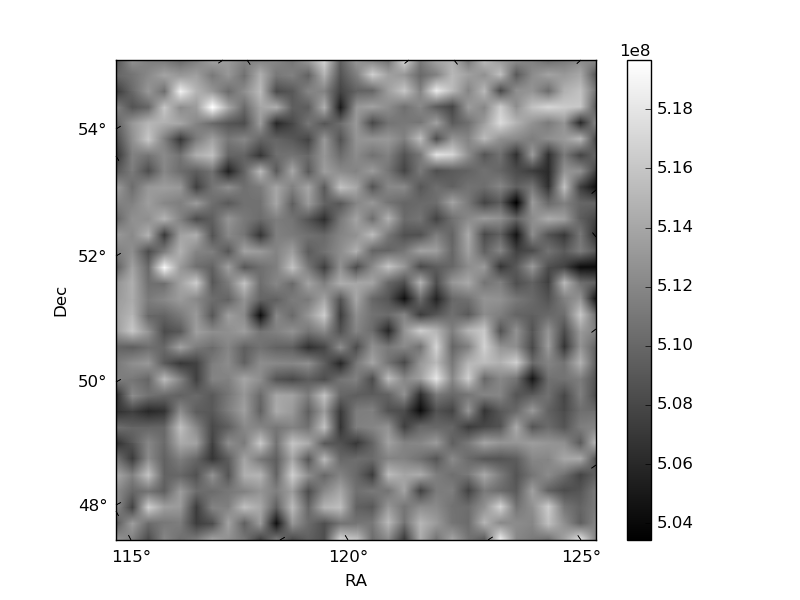
Histogram calculated using DETX and DETY for each event in the final _common_clean file
| Quadrant A |  |
 |
Quadrant B |
|---|---|---|---|
| Quadrant D |  |
 |
Quadrant C |
| Plot type | Count rate plots | Images |
|---|---|---|
| Comparison with Poisson distribution Blue bars denote a histogram of data divided into 1 sec bins. Red curve is a Poisson curve with rate = median count rate of data. |
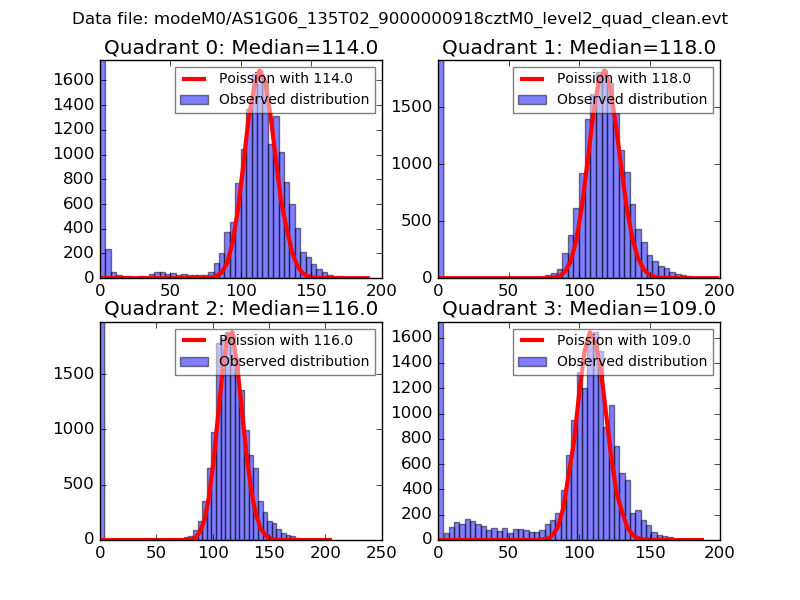 |
 |
| Quadrant-wise count rates Data is divided into 100 sec bins |
 |
|
| Module-wise count rates for Quadrant A Data is divided into 100 sec bins |
 |
 |
| Module-wise count rates for Quadrant B Data is divided into 100 sec bins |
 |
 |
| Module-wise count rates for Quadrant C Data is divided into 100 sec bins |
 |
 |
| Module-wise count rates for Quadrant D Data is divided into 100 sec bins |
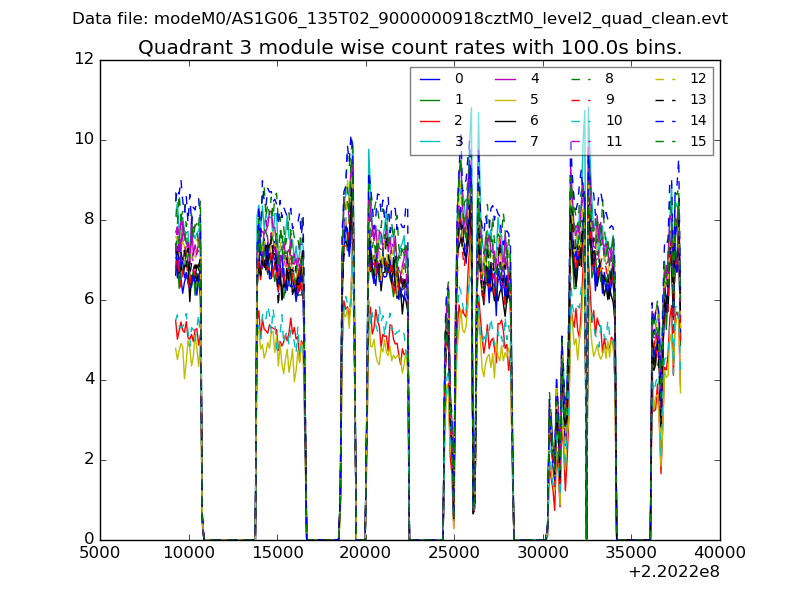 |
 |
| Parameter | Plot |
|---|---|
| CZT HV Monitor | 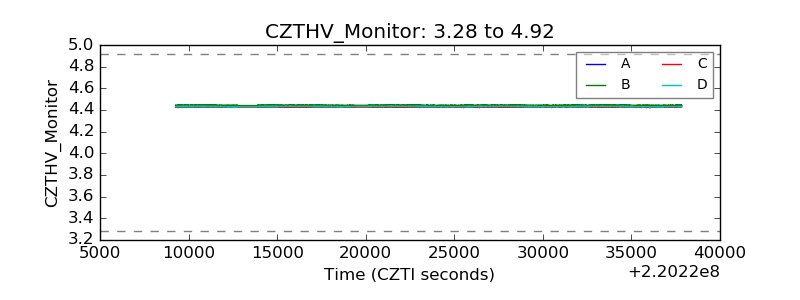 |
| D_VDD |  |
| Temperature 1 |  |
| Veto HV Monitor |  |
| Veto LLD | 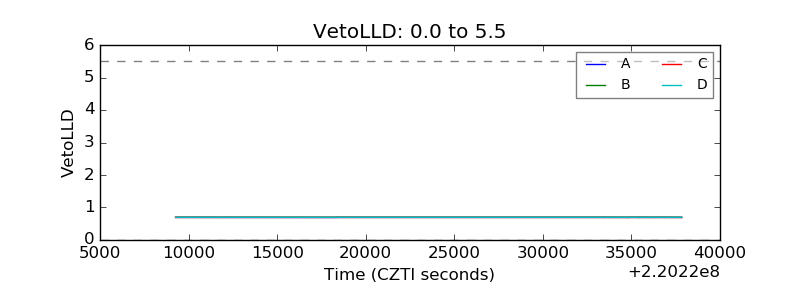 |
| Alpha Counter |  |
| _CPM_Rate |  |
| CZT Counter | 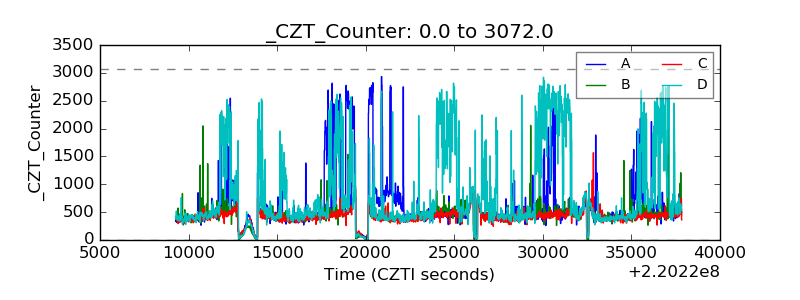 |
| +2.5 Volts monitor |  |
| +5 Volts monitor |  |
| _ROLL_ROT |  |
| _Roll_DEC | 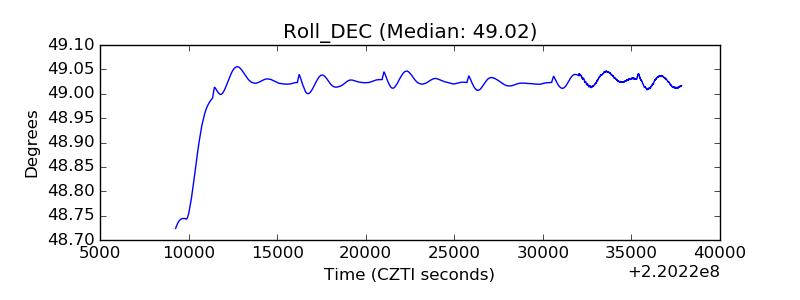 |
| _Roll_RA |  |
| Veto Counter |  |