| Param | Original file | Final file |
|---|---|---|
| Filename | modeM0/AS1T01_145T01_9000000916cztM0_level2.evt | modeM0/AS1T01_145T01_9000000916cztM0_level2_quad_clean.evt |
| Size (bytes) | 5,714,942,400 | 1,233,129,600 |
| Size | 5.3 GB | 1.1 GB |
| Events in quadrant A | 32,775,903 | 8,446,050 |
| Events in quadrant B | 34,800,897 | 8,544,476 |
| Events in quadrant C | 30,833,011 | 8,410,822 |
| Events in quadrant D | 69,886,583 | 7,083,859 |
| Mode M0 | |||
|---|---|---|---|
| Quadrant | BADHDUFLAG | Total packets | Discarded packets |
| A | 0 | 147815 | 0 |
| B | 0 | 152254 | 0 |
| C | 0 | 144685 | 0 |
| D | 0 | 256690 | 0 |
| Mode M9 | |||
|---|---|---|---|
| Quadrant | BADHDUFLAG | Total packets | Discarded packets |
| A | 0 | 104 | 0 |
| B | 0 | 104 | 0 |
| C | 0 | 104 | 0 |
| D | 0 | 104 | 0 |
| Mode SS | |||
|---|---|---|---|
| Quadrant | BADHDUFLAG | Total packets | Discarded packets |
| A | 0 | 1448 | 0 |
| B | 0 | 1448 | 0 |
| C | 0 | 1448 | 0 |
| D | 0 | 1448 | 0 |
| Quadrant | Total seconds | Saturated seconds | Saturation percentage |
|---|---|---|---|
| A | 70918 | 1092 | 1.539807% |
| B | 70918 | 1335 | 1.882456% |
| C | 70918 | 825 | 1.163315% |
| D | 70918 | 12744 | 17.970050% |
Noise dominated data is calculated using 1-second bins in cleaned event files. If a bin has >2000 counts, and if more than 50% of those come from <1% of pixels, then it is considered to be noise-dominated and hence unusable.
| Quadrant | # 1 sec bins | Bins with >0 counts | Bins with >2000 counts | High rate bins dominated by noise | Noise dominated (total time) | Noise dominated (detector-on time) | Marked lightcurve |
|---|---|---|---|---|---|---|---|
| A | 81388 | 70935 | 79 | 79 | 0.10% | 0.11% |  |
| B | 81388 | 70935 | 150 | 150 | 0.18% | 0.21% | 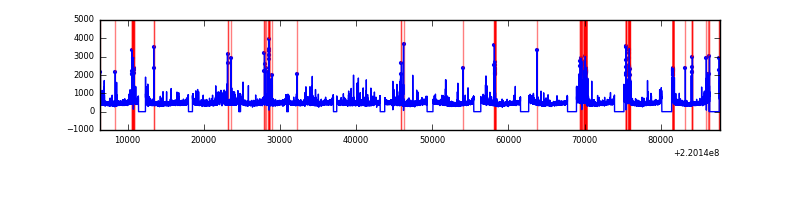 |
| C | 81388 | 70935 | 1 | 1 | 0.00% | 0.00% |  |
| D | 81388 | 70935 | 9554 | 9554 | 11.74% | 13.47% | 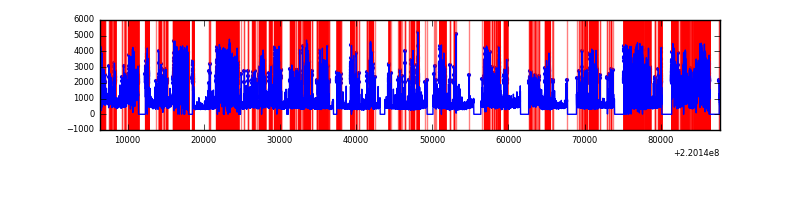 |
Top three noisy pixels from each quadrant. If the there are fewer than three noisy pixels in the level2.evt file, extra rows are filled as -1
| Pixel properties | Quadrant properties | ||||||
|---|---|---|---|---|---|---|---|
| Quadrant | DetID | PixID | Counts | Sigma | Mean | Median | Sigma |
| A | 8 | 15 | 1064550 | 656.64 | 8033 | 7862 | 1609.2 |
| A | 13 | 251 | 297550 | 180.02 | 8033 | 7862 | 1609.2 |
| A | 14 | 111 | 282976 | 170.96 | 8033 | 7862 | 1609.2 |
| B | 4 | 80 | 958491 | 622.75 | 8136 | 7945 | 1526.4 |
| B | 0 | 214 | 549786 | 354.98 | 8136 | 7945 | 1526.4 |
| B | 0 | 228 | 466170 | 300.2 | 8136 | 7945 | 1526.4 |
| C | 9 | 54 | 140272 | 74.01 | 7819 | 7835 | 1789.5 |
| C | 9 | 247 | 75448 | 37.78 | 7819 | 7835 | 1789.5 |
| C | 13 | 61 | 62495 | 30.54 | 7819 | 7835 | 1789.5 |
| D | 2 | 33 | 27326643 | 16071.8 | 7026 | 6807 | 1699.9 |
| D | 8 | 195 | 8029258 | 4719.47 | 7026 | 6807 | 1699.9 |
| D | 2 | 63 | 3177980 | 1865.55 | 7026 | 6807 | 1699.9 |
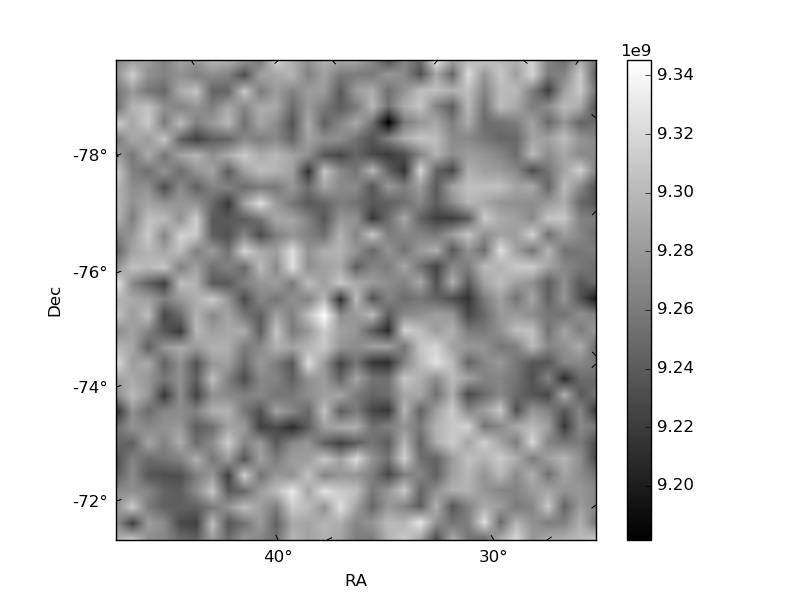
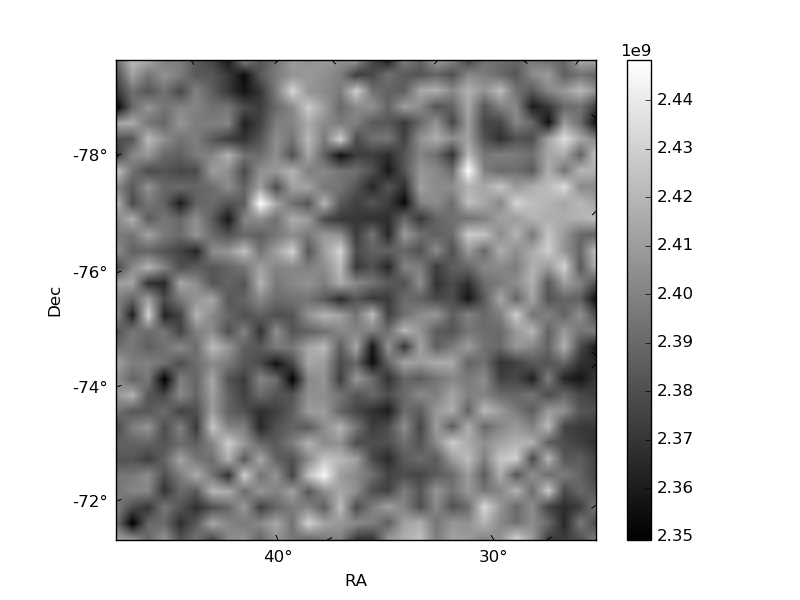
Histogram calculated using DETX and DETY for each event in the final _common_clean file
| Quadrant A |  |
 |
Quadrant B |
|---|---|---|---|
| Quadrant D |  |
 |
Quadrant C |
| Plot type | Count rate plots | Images |
|---|---|---|
| Comparison with Poisson distribution Blue bars denote a histogram of data divided into 1 sec bins. Red curve is a Poisson curve with rate = median count rate of data. |
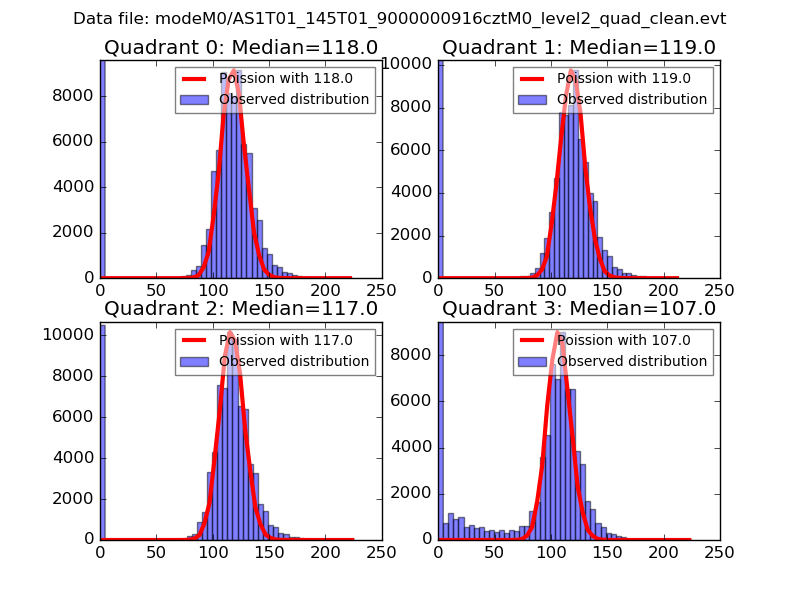 |
 |
| Quadrant-wise count rates Data is divided into 100 sec bins |
 |
|
| Module-wise count rates for Quadrant A Data is divided into 100 sec bins |
 |
 |
| Module-wise count rates for Quadrant B Data is divided into 100 sec bins |
 |
 |
| Module-wise count rates for Quadrant C Data is divided into 100 sec bins |
 |
 |
| Module-wise count rates for Quadrant D Data is divided into 100 sec bins |
 |
 |
| Parameter | Plot |
|---|---|
| CZT HV Monitor | 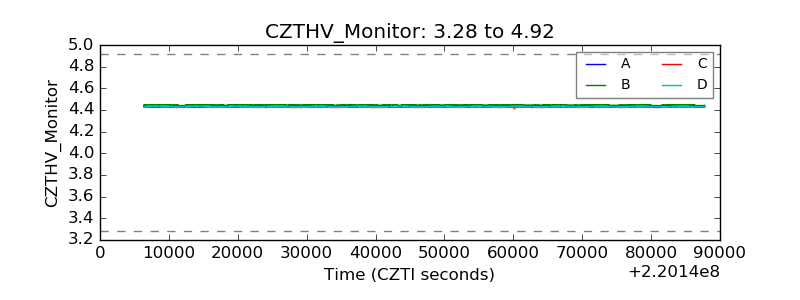 |
| D_VDD |  |
| Temperature 1 |  |
| Veto HV Monitor |  |
| Veto LLD |  |
| Alpha Counter |  |
| _CPM_Rate |  |
| CZT Counter |  |
| +2.5 Volts monitor |  |
| +5 Volts monitor |  |
| _ROLL_ROT |  |
| _Roll_DEC |  |
| _Roll_RA | 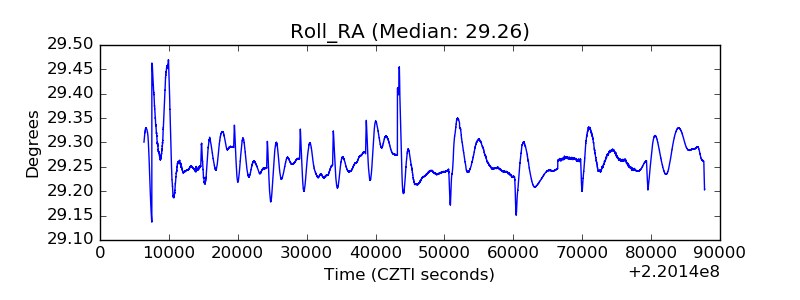 |
| Veto Counter |  |