| Param | Original file | Final file |
|---|---|---|
| Filename | modeM0/AS1G06_145T01_9000000914cztM0_level2.evt | modeM0/AS1G06_145T01_9000000914cztM0_level2_quad_clean.evt |
| Size (bytes) | 1,268,153,280 | 213,284,160 |
| Size | 1.2 GB | 203.4 MB |
| Events in quadrant A | 6,970,341 | 1,379,632 |
| Events in quadrant B | 7,459,056 | 1,416,096 |
| Events in quadrant C | 6,672,316 | 1,412,459 |
| Events in quadrant D | 16,295,026 | 1,218,514 |
| Mode M9 | |||
|---|---|---|---|
| Quadrant | BADHDUFLAG | Total packets | Discarded packets |
| A | 0 | 38 | 0 |
| B | 0 | 38 | 0 |
| C | 0 | 38 | 0 |
| D | 0 | 38 | 0 |
| Mode M0 | |||
|---|---|---|---|
| Quadrant | BADHDUFLAG | Total packets | Discarded packets |
| A | 0 | 31279 | 0 |
| B | 0 | 32393 | 0 |
| C | 0 | 30535 | 0 |
| D | 0 | 58830 | 0 |
| Mode SS | |||
|---|---|---|---|
| Quadrant | BADHDUFLAG | Total packets | Discarded packets |
| A | 0 | 306 | 0 |
| B | 0 | 306 | 0 |
| C | 0 | 306 | 0 |
| D | 0 | 306 | 0 |
| Quadrant | Total seconds | Saturated seconds | Saturation percentage |
|---|---|---|---|
| A | 14960 | 124 | 0.828877% |
| B | 14960 | 159 | 1.062834% |
| C | 14960 | 52 | 0.347594% |
| D | 14960 | 1783 | 11.918449% |
Noise dominated data is calculated using 1-second bins in cleaned event files. If a bin has >2000 counts, and if more than 50% of those come from <1% of pixels, then it is considered to be noise-dominated and hence unusable.
| Quadrant | # 1 sec bins | Bins with >0 counts | Bins with >2000 counts | High rate bins dominated by noise | Noise dominated (total time) | Noise dominated (detector-on time) | Marked lightcurve |
|---|---|---|---|---|---|---|---|
| A | 17535 | 14962 | 28 | 28 | 0.16% | 0.19% |  |
| B | 17535 | 14962 | 28 | 28 | 0.16% | 0.19% |  |
| C | 17535 | 14962 | 0 | 0 | 0.00% | 0.00% | 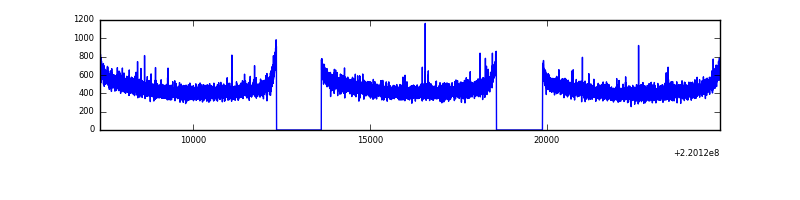 |
| D | 17535 | 14962 | 1360 | 1360 | 7.76% | 9.09% |  |
Top three noisy pixels from each quadrant. If the there are fewer than three noisy pixels in the level2.evt file, extra rows are filled as -1
| Pixel properties | Quadrant properties | ||||||
|---|---|---|---|---|---|---|---|
| Quadrant | DetID | PixID | Counts | Sigma | Mean | Median | Sigma |
| A | 14 | 111 | 174785 | 506.96 | 1714 | 1677 | 341.5 |
| A | 8 | 15 | 136834 | 395.82 | 1714 | 1677 | 341.5 |
| A | 4 | 2 | 28875 | 79.65 | 1714 | 1677 | 341.5 |
| B | 0 | 219 | 235010 | 726.11 | 1741 | 1699 | 321.3 |
| B | 4 | 48 | 112533 | 344.94 | 1741 | 1699 | 321.3 |
| B | 4 | 81 | 105107 | 321.82 | 1741 | 1699 | 321.3 |
| C | 13 | 61 | 13600 | 30.82 | 1699 | 1706 | 385.9 |
| C | 8 | 128 | 13259 | 29.94 | 1699 | 1706 | 385.9 |
| C | 12 | 4 | 9870 | 21.16 | 1699 | 1706 | 385.9 |
| D | 8 | 195 | 4980892 | 12810.47 | 1606 | 1558 | 388.7 |
| D | 2 | 33 | 3343830 | 8598.75 | 1606 | 1558 | 388.7 |
| D | 2 | 152 | 828134 | 2126.55 | 1606 | 1558 | 388.7 |
Histogram calculated using DETX and DETY for each event in the final _common_clean file
| Quadrant A |  |
 |
Quadrant B |
|---|---|---|---|
| Quadrant D |  |
 |
Quadrant C |
| Plot type | Count rate plots | Images |
|---|---|---|
| Comparison with Poisson distribution Blue bars denote a histogram of data divided into 1 sec bins. Red curve is a Poisson curve with rate = median count rate of data. |
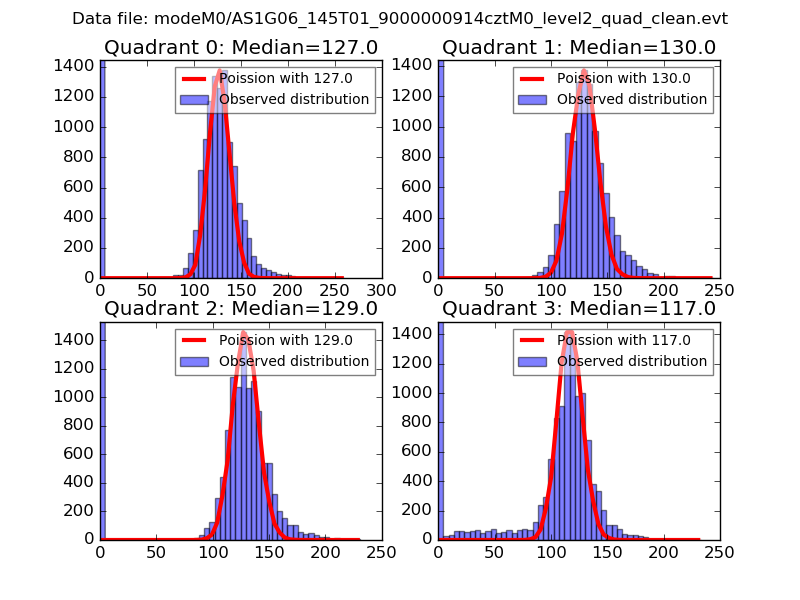 |
 |
| Quadrant-wise count rates Data is divided into 100 sec bins |
 |
|
| Module-wise count rates for Quadrant A Data is divided into 100 sec bins |
 |
 |
| Module-wise count rates for Quadrant B Data is divided into 100 sec bins |
 |
 |
| Module-wise count rates for Quadrant C Data is divided into 100 sec bins |
 |
 |
| Module-wise count rates for Quadrant D Data is divided into 100 sec bins |
 |
 |
| Parameter | Plot |
|---|---|
| CZT HV Monitor |  |
| D_VDD |  |
| Temperature 1 |  |
| Veto HV Monitor | 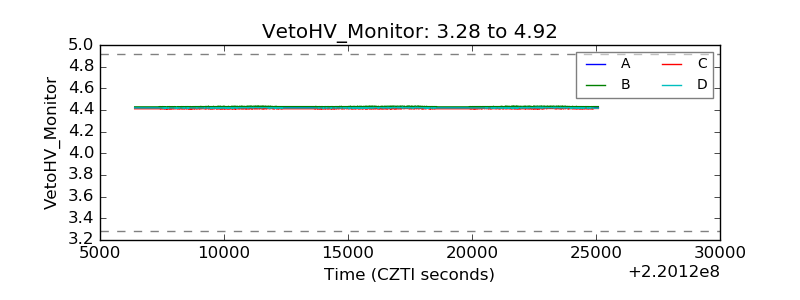 |
| Veto LLD |  |
| Alpha Counter |  |
| _CPM_Rate |  |
| CZT Counter |  |
| +2.5 Volts monitor |  |
| +5 Volts monitor |  |
| _ROLL_ROT |  |
| _Roll_DEC |  |
| _Roll_RA |  |
| Veto Counter |  |