| Param | Original file | Final file |
|---|---|---|
| Filename | modeM0/AS1G06_135T01_9000000908cztM0_level2.evt | modeM0/AS1G06_135T01_9000000908cztM0_level2_quad_clean.evt |
| Size (bytes) | 684,720,000 | 111,421,440 |
| Size | 653.0 MB | 106.3 MB |
| Events in quadrant A | 3,933,671 | 735,010 |
| Events in quadrant B | 4,199,827 | 742,176 |
| Events in quadrant C | 3,907,343 | 722,826 |
| Events in quadrant D | 8,115,151 | 579,203 |
| Mode M9 | |||
|---|---|---|---|
| Quadrant | BADHDUFLAG | Total packets | Discarded packets |
| A | 0 | 19 | 0 |
| B | 0 | 19 | 0 |
| C | 0 | 19 | 0 |
| D | 0 | 19 | 0 |
| Mode M0 | |||
|---|---|---|---|
| Quadrant | BADHDUFLAG | Total packets | Discarded packets |
| A | 0 | 17663 | 0 |
| B | 0 | 18209 | 0 |
| C | 0 | 17690 | 0 |
| D | 0 | 30080 | 0 |
| Mode SS | |||
|---|---|---|---|
| Quadrant | BADHDUFLAG | Total packets | Discarded packets |
| A | 0 | 174 | 0 |
| B | 0 | 174 | 0 |
| C | 0 | 174 | 0 |
| D | 0 | 174 | 0 |
| Quadrant | Total seconds | Saturated seconds | Saturation percentage |
|---|---|---|---|
| A | 8560 | 113 | 1.320093% |
| B | 8560 | 146 | 1.705607% |
| C | 8560 | 94 | 1.098131% |
| D | 8560 | 1663 | 19.427570% |
Noise dominated data is calculated using 1-second bins in cleaned event files. If a bin has >2000 counts, and if more than 50% of those come from <1% of pixels, then it is considered to be noise-dominated and hence unusable.
| Quadrant | # 1 sec bins | Bins with >0 counts | Bins with >2000 counts | High rate bins dominated by noise | Noise dominated (total time) | Noise dominated (detector-on time) | Marked lightcurve |
|---|---|---|---|---|---|---|---|
| A | 10520 | 8562 | 0 | 0 | 0.00% | 0.00% |  |
| B | 10520 | 8562 | 23 | 23 | 0.22% | 0.27% |  |
| C | 10520 | 8562 | 2 | 2 | 0.02% | 0.02% |  |
| D | 10520 | 8562 | 1372 | 1372 | 13.04% | 16.02% |  |
Top three noisy pixels from each quadrant. If the there are fewer than three noisy pixels in the level2.evt file, extra rows are filled as -1
| Pixel properties | Quadrant properties | ||||||
|---|---|---|---|---|---|---|---|
| Quadrant | DetID | PixID | Counts | Sigma | Mean | Median | Sigma |
| A | 8 | 15 | 16296 | 74.67 | 1009 | 987 | 205.0 |
| A | 0 | 226 | 9777 | 42.87 | 1009 | 987 | 205.0 |
| A | 12 | 194 | 9361 | 40.84 | 1009 | 987 | 205.0 |
| B | 0 | 214 | 105472 | 539.19 | 1015 | 991 | 193.8 |
| B | 4 | 80 | 45214 | 228.22 | 1015 | 991 | 193.8 |
| B | 4 | 81 | 28886 | 143.96 | 1015 | 991 | 193.8 |
| C | 9 | 247 | 74120 | 322.84 | 976 | 981 | 226.5 |
| C | 1 | 3 | 11062 | 44.5 | 976 | 981 | 226.5 |
| C | 9 | 221 | 10415 | 41.64 | 976 | 981 | 226.5 |
| D | 2 | 33 | 4514282 | 20970.95 | 881 | 853 | 215.2 |
| D | 2 | 63 | 94522 | 435.22 | 881 | 853 | 215.2 |
| D | 2 | 152 | 72309 | 332.01 | 881 | 853 | 215.2 |
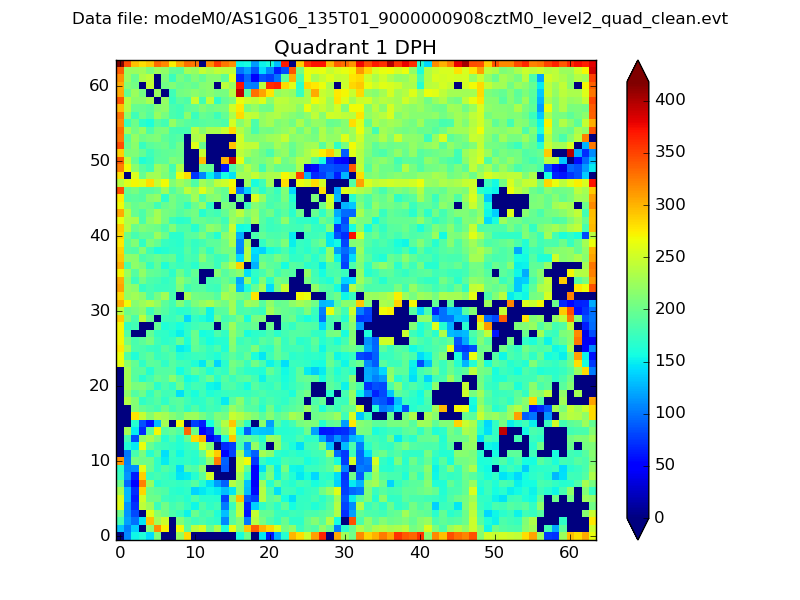
Histogram calculated using DETX and DETY for each event in the final _common_clean file
| Quadrant A |  |
 |
Quadrant B |
|---|---|---|---|
| Quadrant D |  |
 |
Quadrant C |
| Plot type | Count rate plots | Images |
|---|---|---|
| Comparison with Poisson distribution Blue bars denote a histogram of data divided into 1 sec bins. Red curve is a Poisson curve with rate = median count rate of data. |
 |
 |
| Quadrant-wise count rates Data is divided into 100 sec bins |
 |
|
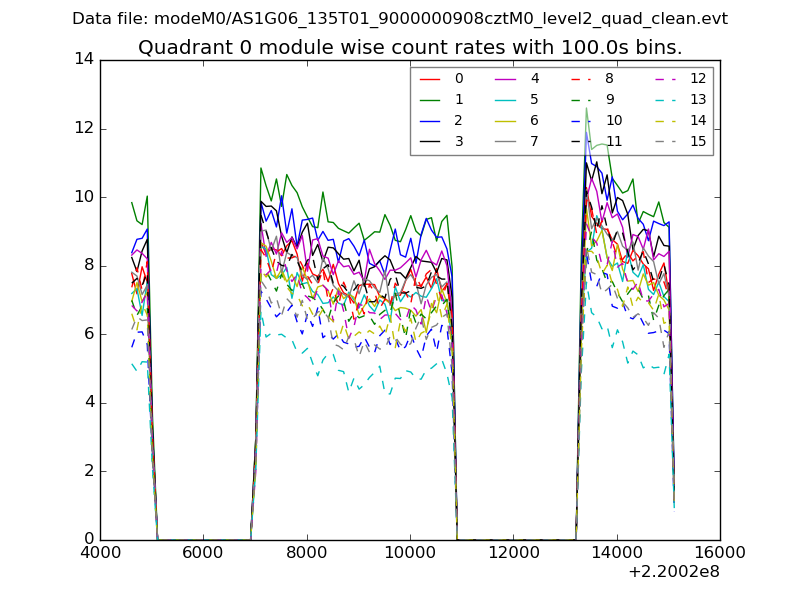
| Module-wise count rates for Quadrant A Data is divided into 100 sec bins |
 |
 |
| Module-wise count rates for Quadrant B Data is divided into 100 sec bins |
 |
 |
| Module-wise count rates for Quadrant C Data is divided into 100 sec bins |
 |
 |
| Module-wise count rates for Quadrant D Data is divided into 100 sec bins |
 |
 |
| Parameter | Plot |
|---|---|
| CZT HV Monitor |  |
| D_VDD |  |
| Temperature 1 |  |
| Veto HV Monitor |  |
| Veto LLD |  |
| Alpha Counter |  |
| _CPM_Rate |  |
| CZT Counter |  |
| +2.5 Volts monitor |  |
| +5 Volts monitor |  |
| _ROLL_ROT |  |
| _Roll_DEC |  |
| _Roll_RA |  |
| Veto Counter |  |