| Param | Original file | Final file |
|---|---|---|
| Filename | modeM0/AS1G06_102T01_9000000912cztM0_level2.evt | modeM0/AS1G06_102T01_9000000912cztM0_level2_quad_clean.evt |
| Size (bytes) | 4,993,032,960 | 693,898,560 |
| Size | 4.7 GB | 661.8 MB |
| Events in quadrant A | 33,503,281 | 4,315,595 |
| Events in quadrant B | 29,588,609 | 4,368,600 |
| Events in quadrant C | 26,878,205 | 4,344,684 |
| Events in quadrant D | 57,318,305 | 3,986,924 |
| Mode SS | |||
|---|---|---|---|
| Quadrant | BADHDUFLAG | Total packets | Discarded packets |
| A | 0 | 1186 | 0 |
| B | 0 | 1186 | 0 |
| C | 0 | 1186 | 0 |
| D | 0 | 1186 | 0 |
| Mode M9 | |||
|---|---|---|---|
| Quadrant | BADHDUFLAG | Total packets | Discarded packets |
| A | 0 | 66 | 0 |
| B | 0 | 66 | 0 |
| C | 0 | 66 | 0 |
| D | 0 | 66 | 0 |
| Mode M0 | |||
|---|---|---|---|
| Quadrant | BADHDUFLAG | Total packets | Discarded packets |
| A | 0 | 139935 | 0 |
| B | 0 | 127883 | 0 |
| C | 0 | 122189 | 0 |
| D | 0 | 211348 | 0 |
| Quadrant | Total seconds | Saturated seconds | Saturation percentage |
|---|---|---|---|
| A | 58316 | 1623 | 2.783113% |
| B | 58309 | 1187 | 2.035706% |
| C | 58322 | 733 | 1.256816% |
| D | 58320 | 9351 | 16.033951% |
Noise dominated data is calculated using 1-second bins in cleaned event files. If a bin has >2000 counts, and if more than 50% of those come from <1% of pixels, then it is considered to be noise-dominated and hence unusable.
| Quadrant | # 1 sec bins | Bins with >0 counts | Bins with >2000 counts | High rate bins dominated by noise | Noise dominated (total time) | Noise dominated (detector-on time) | Marked lightcurve |
|---|---|---|---|---|---|---|---|
| A | 64931 | 58345 | 296 | 296 | 0.46% | 0.51% |  |
| B | 64931 | 58334 | 177 | 177 | 0.27% | 0.30% |  |
| C | 64931 | 58349 | 110 | 110 | 0.17% | 0.19% |  |
| D | 64931 | 58344 | 6808 | 6808 | 10.48% | 11.67% |  |
Top three noisy pixels from each quadrant. If the there are fewer than three noisy pixels in the level2.evt file, extra rows are filled as -1
| Pixel properties | Quadrant properties | ||||||
|---|---|---|---|---|---|---|---|
| Quadrant | DetID | PixID | Counts | Sigma | Mean | Median | Sigma |
| A | 13 | 251 | 5954415 | 4339.58 | 6768 | 6611 | 1370.6 |
| A | 8 | 15 | 815048 | 589.84 | 6768 | 6611 | 1370.6 |
| A | 14 | 111 | 367804 | 263.53 | 6768 | 6611 | 1370.6 |
| B | 0 | 228 | 1198961 | 917.88 | 6837 | 6680 | 1298.9 |
| B | 4 | 48 | 419342 | 317.69 | 6837 | 6680 | 1298.9 |
| B | 0 | 219 | 373359 | 282.29 | 6837 | 6680 | 1298.9 |
| C | 9 | 247 | 936157 | 608.89 | 6603 | 6630 | 1526.6 |
| C | 4 | 254 | 121171 | 75.03 | 6603 | 6630 | 1526.6 |
| C | 13 | 61 | 52659 | 30.15 | 6603 | 6630 | 1526.6 |
| D | 2 | 33 | 20064409 | 13371.82 | 6114 | 5918 | 1500.1 |
| D | 8 | 195 | 8786116 | 5853.25 | 6114 | 5918 | 1500.1 |
| D | 12 | 221 | 1582328 | 1050.9 | 6114 | 5918 | 1500.1 |
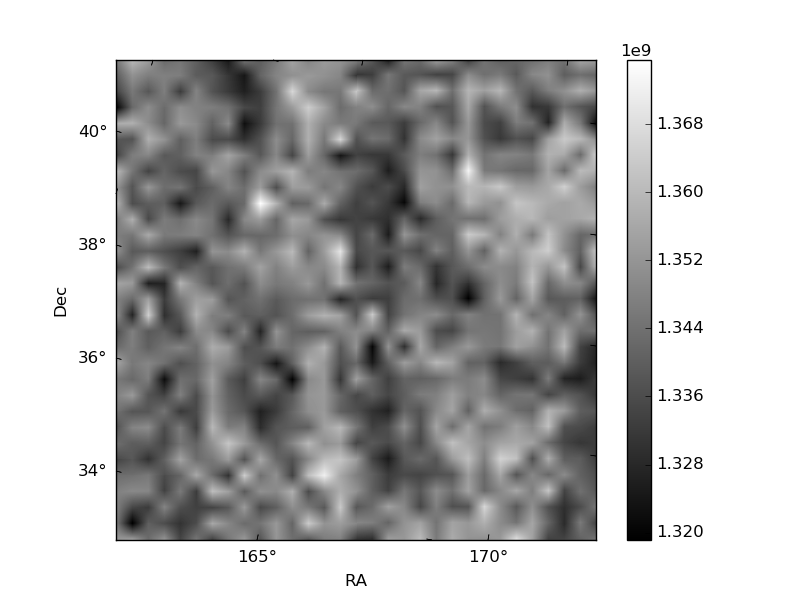
Histogram calculated using DETX and DETY for each event in the final _common_clean file
| Quadrant A |  |
 |
Quadrant B |
|---|---|---|---|
| Quadrant D | 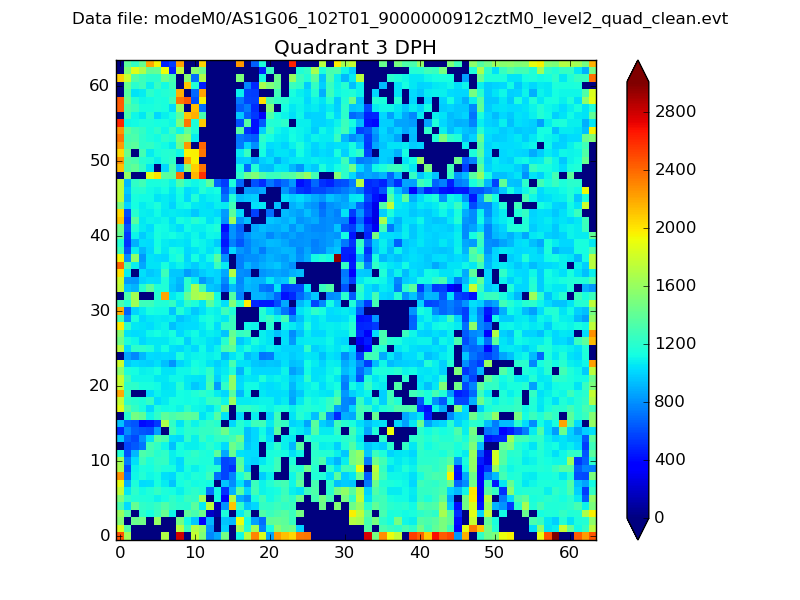 |
 |
Quadrant C |
| Plot type | Count rate plots | Images |
|---|---|---|
| Comparison with Poisson distribution Blue bars denote a histogram of data divided into 1 sec bins. Red curve is a Poisson curve with rate = median count rate of data. |
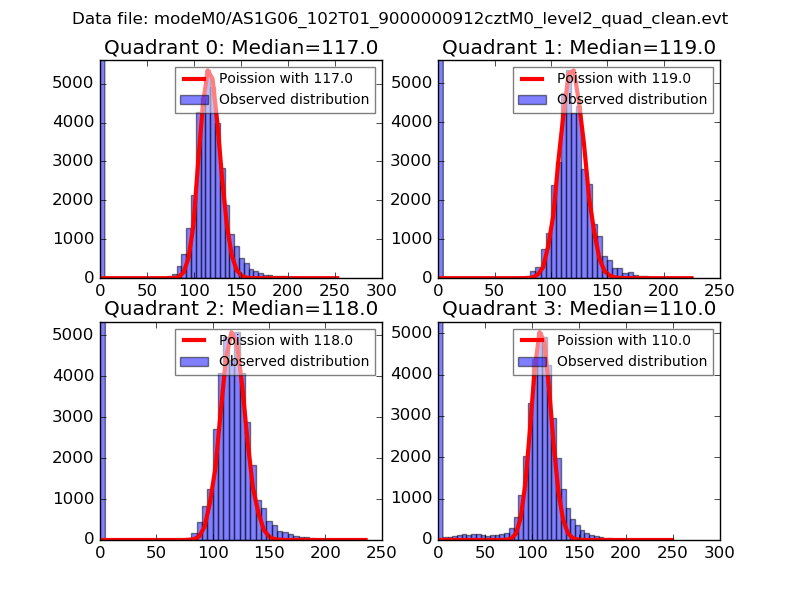 |
 |
| Quadrant-wise count rates Data is divided into 100 sec bins |
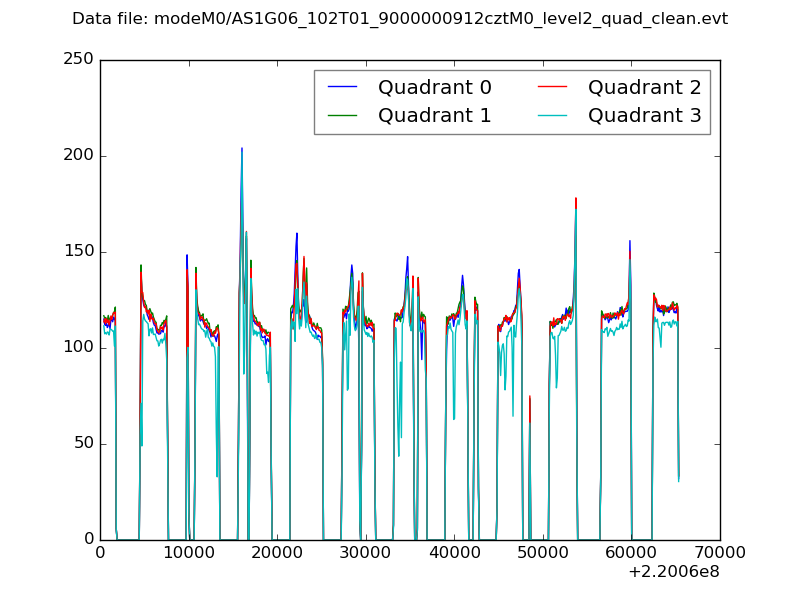 |
|
| Module-wise count rates for Quadrant A Data is divided into 100 sec bins |
 |
 |
| Module-wise count rates for Quadrant B Data is divided into 100 sec bins |
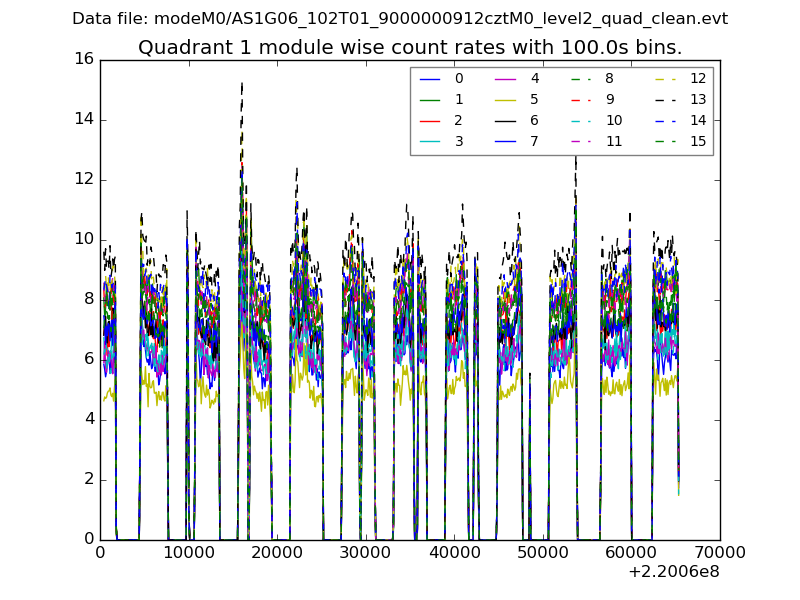 |
 |
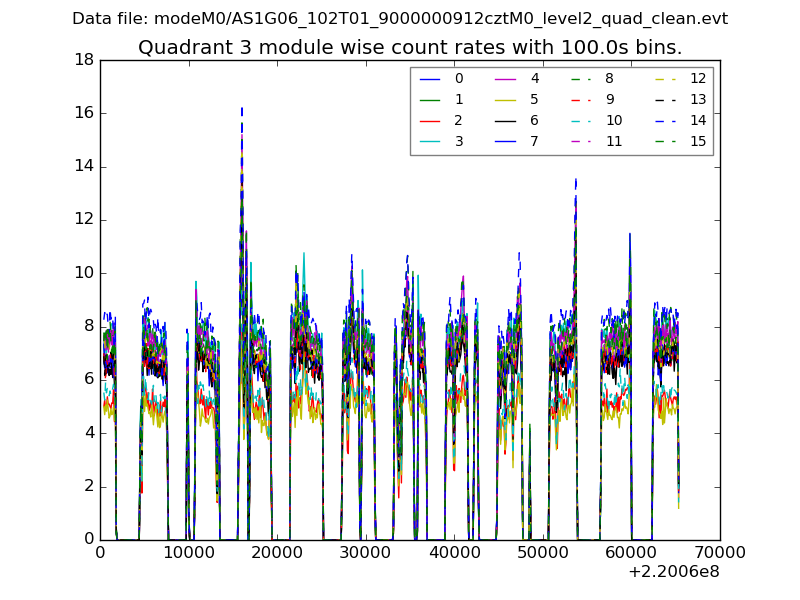
| Module-wise count rates for Quadrant C Data is divided into 100 sec bins |
 |
 |
| Module-wise count rates for Quadrant D Data is divided into 100 sec bins |
 |
 |
| Parameter | Plot |
|---|---|
| CZT HV Monitor |  |
| D_VDD |  |
| Temperature 1 |  |
| Veto HV Monitor | 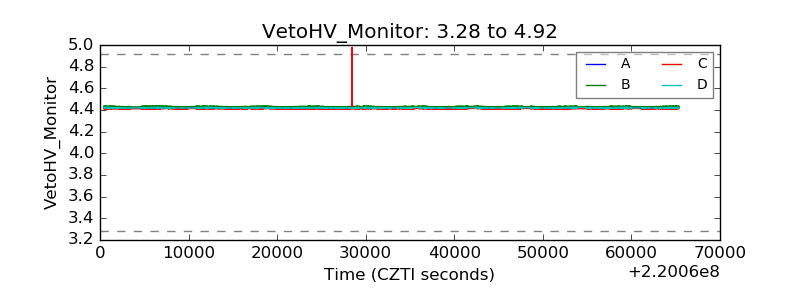 |
| Veto LLD |  |
| Alpha Counter | 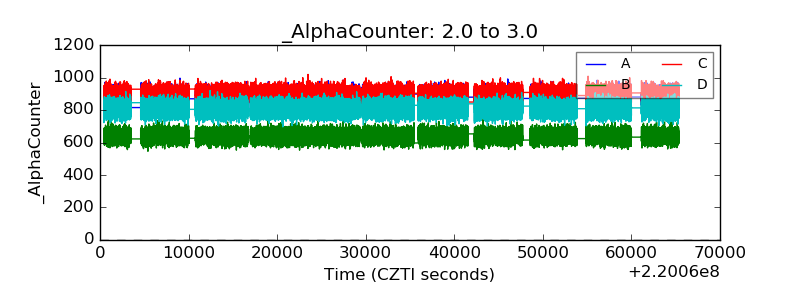 |
| _CPM_Rate | 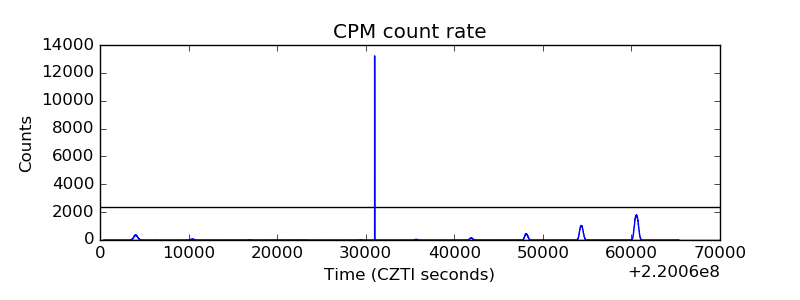 |
| CZT Counter |  |
| +2.5 Volts monitor |  |
| +5 Volts monitor |  |
| _ROLL_ROT |  |
| _Roll_DEC |  |
| _Roll_RA |  |
| Veto Counter |  |