| Param | Original file | Final file |
|---|---|---|
| Filename | modeM0/AS1A02_170T03_9000000910cztM0_level2.evt | modeM0/AS1A02_170T03_9000000910cztM0_level2_quad_clean.evt |
| Size (bytes) | 1,629,023,040 | 223,862,400 |
| Size | 1.5 GB | 213.5 MB |
| Events in quadrant A | 9,748,900 | 1,496,374 |
| Events in quadrant B | 9,335,004 | 1,510,348 |
| Events in quadrant C | 9,016,459 | 1,499,165 |
| Events in quadrant D | 20,018,019 | 1,030,058 |
| Mode M9 | |||
|---|---|---|---|
| Quadrant | BADHDUFLAG | Total packets | Discarded packets |
| A | 0 | 50 | 0 |
| B | 0 | 50 | 0 |
| C | 0 | 50 | 0 |
| D | 0 | 50 | 0 |
| Mode M0 | |||
|---|---|---|---|
| Quadrant | BADHDUFLAG | Total packets | Discarded packets |
| A | 0 | 41723 | 0 |
| B | 0 | 40358 | 0 |
| C | 0 | 39817 | 0 |
| D | 0 | 72327 | 0 |
| Mode SS | |||
|---|---|---|---|
| Quadrant | BADHDUFLAG | Total packets | Discarded packets |
| A | 0 | 368 | 0 |
| B | 0 | 368 | 0 |
| C | 0 | 368 | 0 |
| D | 0 | 368 | 0 |
| Quadrant | Total seconds | Saturated seconds | Saturation percentage |
|---|---|---|---|
| A | 18029 | 381 | 2.113262% |
| B | 18029 | 252 | 1.397748% |
| C | 18029 | 245 | 1.358922% |
| D | 18029 | 5004 | 27.755283% |
Noise dominated data is calculated using 1-second bins in cleaned event files. If a bin has >2000 counts, and if more than 50% of those come from <1% of pixels, then it is considered to be noise-dominated and hence unusable.
| Quadrant | # 1 sec bins | Bins with >0 counts | Bins with >2000 counts | High rate bins dominated by noise | Noise dominated (total time) | Noise dominated (detector-on time) | Marked lightcurve |
|---|---|---|---|---|---|---|---|
| A | 23044 | 18032 | 220 | 220 | 0.95% | 1.22% |  |
| B | 23044 | 18033 | 76 | 76 | 0.33% | 0.42% |  |
| C | 23044 | 18033 | 115 | 115 | 0.50% | 0.64% |  |
| D | 23044 | 18032 | 3855 | 3855 | 16.73% | 21.38% |  |
Top three noisy pixels from each quadrant. If the there are fewer than three noisy pixels in the level2.evt file, extra rows are filled as -1
| Pixel properties | Quadrant properties | ||||||
|---|---|---|---|---|---|---|---|
| Quadrant | DetID | PixID | Counts | Sigma | Mean | Median | Sigma |
| A | 14 | 111 | 416407 | 837.68 | 2385 | 2347 | 494.3 |
| A | 8 | 15 | 112184 | 222.21 | 2385 | 2347 | 494.3 |
| A | 3 | 1 | 26831 | 49.53 | 2385 | 2347 | 494.3 |
| B | 4 | 81 | 191343 | 430.67 | 2295 | 2253 | 439.1 |
| B | 4 | 80 | 86714 | 192.37 | 2295 | 2253 | 439.1 |
| B | 0 | 219 | 84694 | 187.77 | 2295 | 2253 | 439.1 |
| C | 9 | 247 | 213865 | 397.35 | 2247 | 2270 | 532.5 |
| C | 1 | 16 | 33793 | 59.2 | 2247 | 2270 | 532.5 |
| C | 13 | 61 | 17217 | 28.07 | 2247 | 2270 | 532.5 |
| D | 2 | 33 | 10724151 | 21230.22 | 1968 | 1921 | 505.0 |
| D | 8 | 195 | 497841 | 981.93 | 1968 | 1921 | 505.0 |
| D | 2 | 63 | 402081 | 792.32 | 1968 | 1921 | 505.0 |
Histogram calculated using DETX and DETY for each event in the final _common_clean file
| Quadrant A | 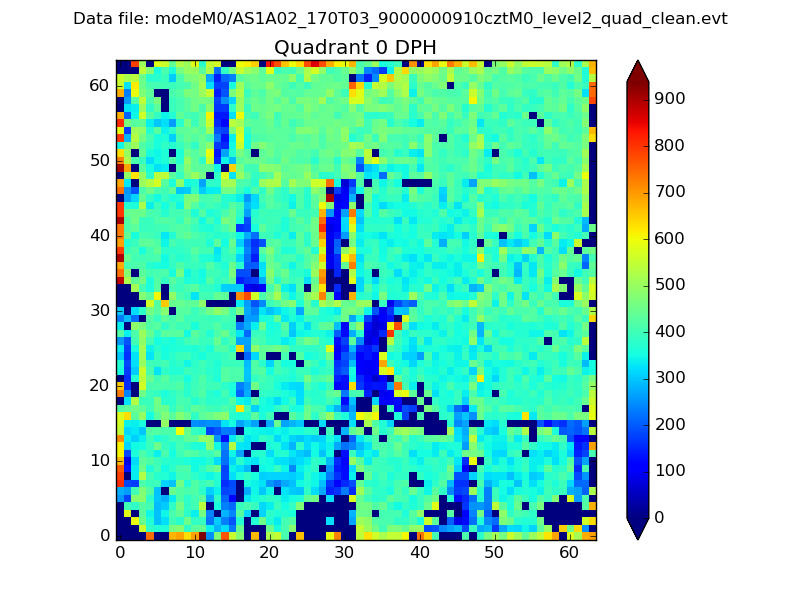 |
 |
Quadrant B |
|---|---|---|---|
| Quadrant D |  |
 |
Quadrant C |
| Plot type | Count rate plots | Images |
|---|---|---|
| Comparison with Poisson distribution Blue bars denote a histogram of data divided into 1 sec bins. Red curve is a Poisson curve with rate = median count rate of data. |
 |
 |
| Quadrant-wise count rates Data is divided into 100 sec bins |
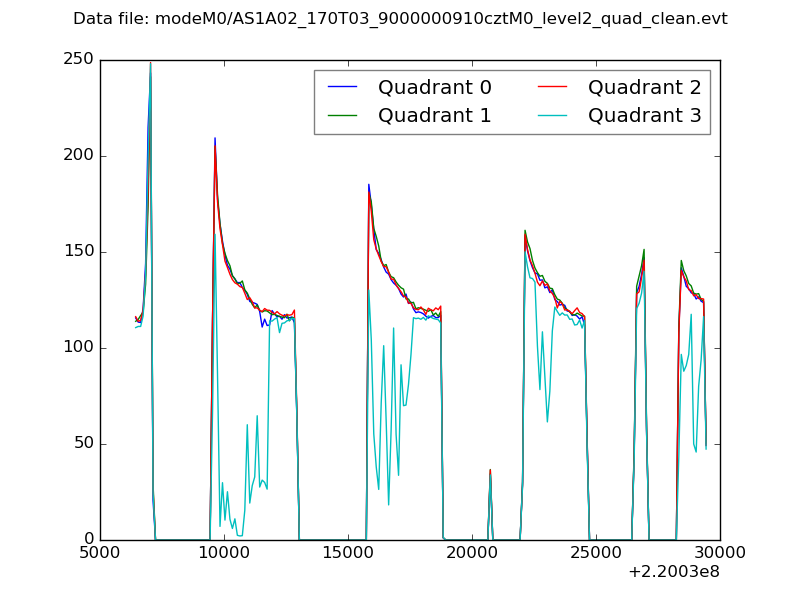 |
|
| Module-wise count rates for Quadrant A Data is divided into 100 sec bins |
 |
 |
| Module-wise count rates for Quadrant B Data is divided into 100 sec bins |
 |
 |
| Module-wise count rates for Quadrant C Data is divided into 100 sec bins |
 |
 |
| Module-wise count rates for Quadrant D Data is divided into 100 sec bins |
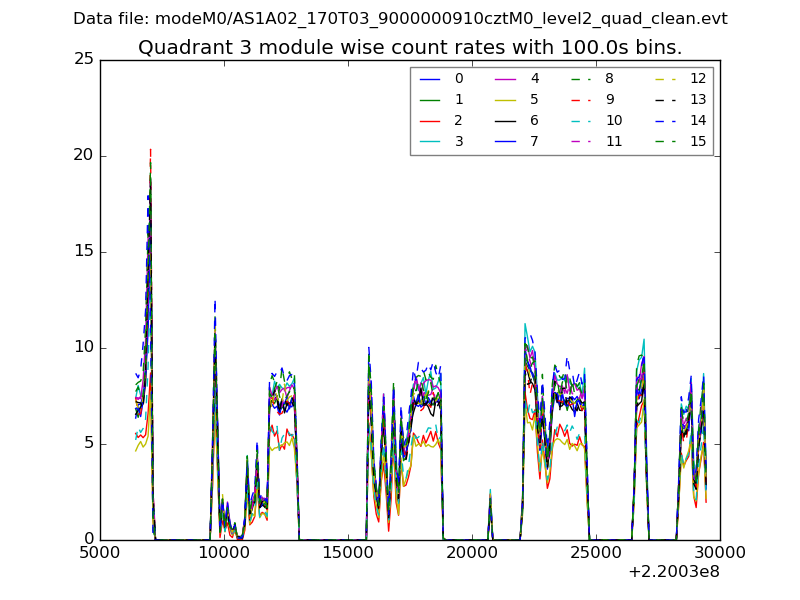 |
 |
| Parameter | Plot |
|---|---|
| CZT HV Monitor | 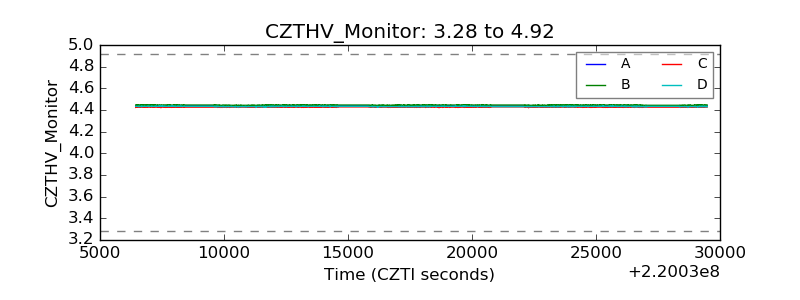 |
| D_VDD |  |
| Temperature 1 |  |
| Veto HV Monitor |  |
| Veto LLD |  |
| Alpha Counter |  |
| _CPM_Rate | 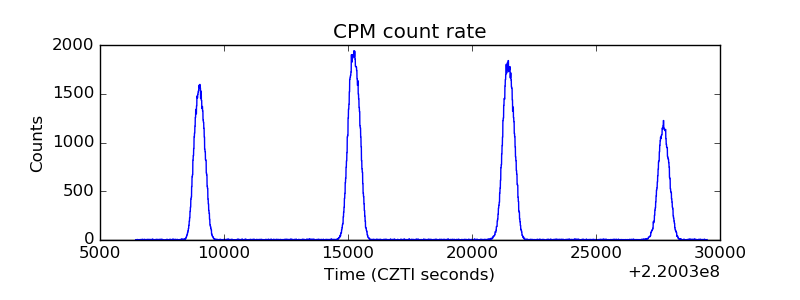 |
| CZT Counter |  |
| +2.5 Volts monitor | 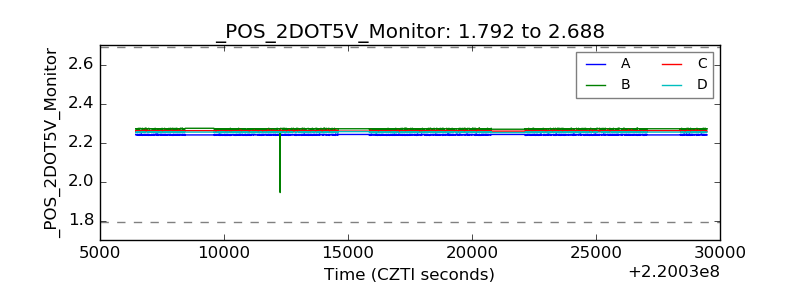 |
| +5 Volts monitor | 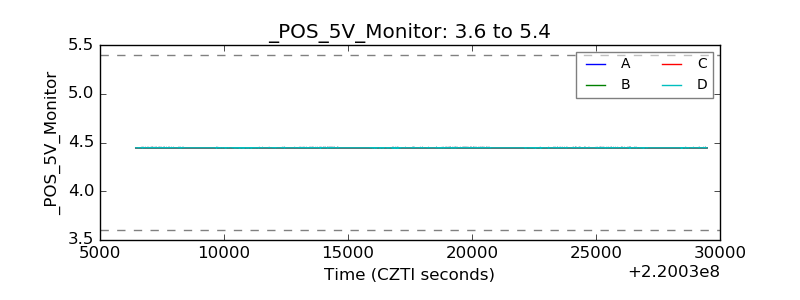 |
| _ROLL_ROT |  |
| _Roll_DEC | 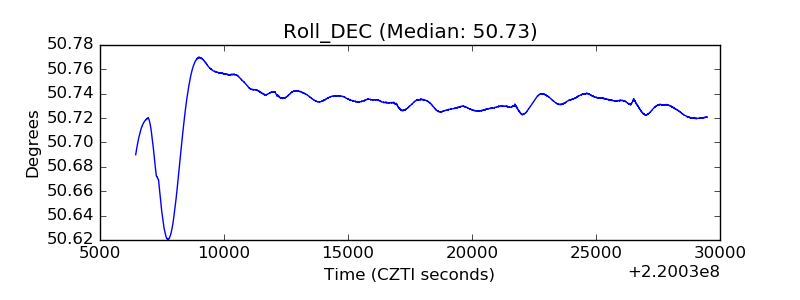 |
| _Roll_RA | 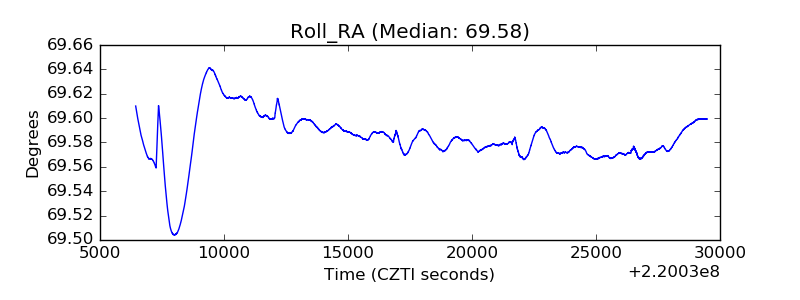 |
| Veto Counter |  |