| Param | Original file | Final file |
|---|---|---|
| Filename | modeM0/AS1A02_075T01_9000000906cztM0_level2.evt | modeM0/AS1A02_075T01_9000000906cztM0_level2_quad_clean.evt |
| Size (bytes) | 649,463,040 | 77,351,040 |
| Size | 619.4 MB | 73.8 MB |
| Events in quadrant A | 3,271,212 | 483,408 |
| Events in quadrant B | 3,401,562 | 478,506 |
| Events in quadrant C | 4,096,226 | 466,595 |
| Events in quadrant D | 8,403,922 | 403,753 |
| Mode SS | |||
|---|---|---|---|
| Quadrant | BADHDUFLAG | Total packets | Discarded packets |
| A | 0 | 148 | 0 |
| B | 0 | 148 | 0 |
| C | 0 | 148 | 0 |
| D | 0 | 148 | 0 |
| Mode M9 | |||
|---|---|---|---|
| Quadrant | BADHDUFLAG | Total packets | Discarded packets |
| A | 0 | 7 | 0 |
| B | 0 | 7 | 0 |
| C | 0 | 7 | 0 |
| D | 0 | 7 | 0 |
| Mode M0 | |||
|---|---|---|---|
| Quadrant | BADHDUFLAG | Total packets | Discarded packets |
| A | 0 | 14842 | 0 |
| B | 0 | 14996 | 0 |
| C | 0 | 17275 | 0 |
| D | 0 | 29996 | 0 |
| Quadrant | Total seconds | Saturated seconds | Saturation percentage |
|---|---|---|---|
| A | 7313 | 66 | 0.902502% |
| B | 7313 | 73 | 0.998222% |
| C | 7313 | 54 | 0.738411% |
| D | 7313 | 1966 | 26.883632% |
Noise dominated data is calculated using 1-second bins in cleaned event files. If a bin has >2000 counts, and if more than 50% of those come from <1% of pixels, then it is considered to be noise-dominated and hence unusable.
| Quadrant | # 1 sec bins | Bins with >0 counts | Bins with >2000 counts | High rate bins dominated by noise | Noise dominated (total time) | Noise dominated (detector-on time) | Marked lightcurve |
|---|---|---|---|---|---|---|---|
| A | 8053 | 7314 | 2 | 2 | 0.02% | 0.03% |  |
| B | 8053 | 7314 | 1 | 1 | 0.01% | 0.01% |  |
| C | 8053 | 7314 | 12 | 12 | 0.15% | 0.16% |  |
| D | 8053 | 7313 | 1461 | 1461 | 18.14% | 19.98% | 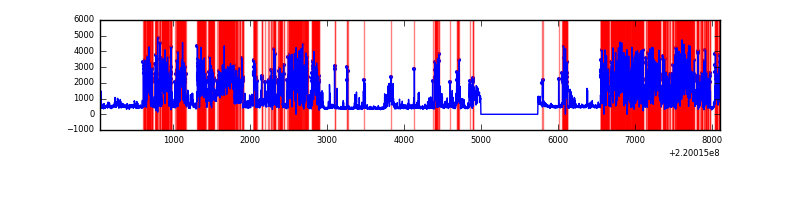 |
Top three noisy pixels from each quadrant. If the there are fewer than three noisy pixels in the level2.evt file, extra rows are filled as -1
| Pixel properties | Quadrant properties | ||||||
|---|---|---|---|---|---|---|---|
| Quadrant | DetID | PixID | Counts | Sigma | Mean | Median | Sigma |
| A | 3 | 1 | 14972 | 82.24 | 838 | 817 | 172.1 |
| A | 14 | 111 | 13149 | 71.65 | 838 | 817 | 172.1 |
| A | 8 | 15 | 10454 | 55.99 | 838 | 817 | 172.1 |
| B | 4 | 80 | 37425 | 223.93 | 842 | 821 | 163.5 |
| B | 0 | 228 | 34220 | 204.32 | 842 | 821 | 163.5 |
| B | 4 | 81 | 26511 | 157.16 | 842 | 821 | 163.5 |
| C | 9 | 247 | 910242 | 4846.62 | 809 | 813 | 187.6 |
| C | 8 | 128 | 12180 | 60.58 | 809 | 813 | 187.6 |
| C | 13 | 61 | 6374 | 29.64 | 809 | 813 | 187.6 |
| D | 2 | 33 | 5399065 | 31057.1 | 710 | 688 | 173.8 |
| D | 8 | 195 | 101240 | 578.48 | 710 | 688 | 173.8 |
| D | 2 | 63 | 87606 | 500.04 | 710 | 688 | 173.8 |
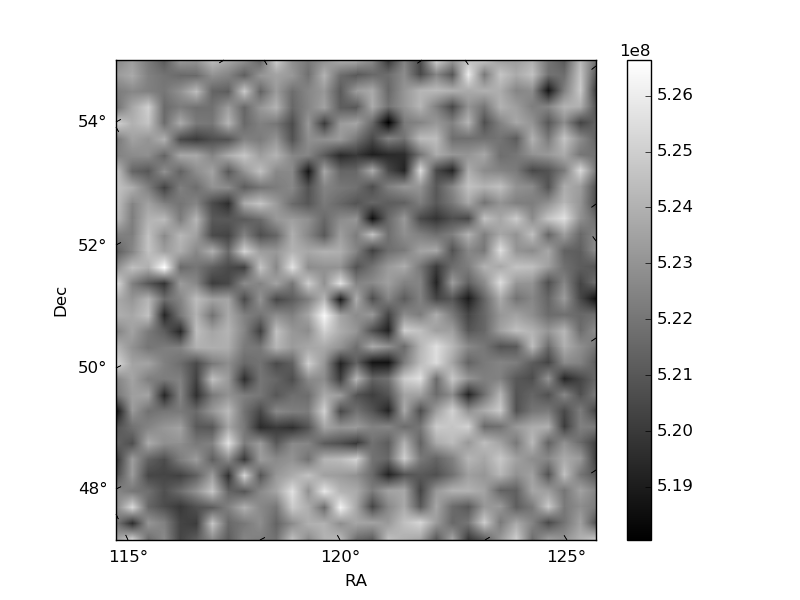
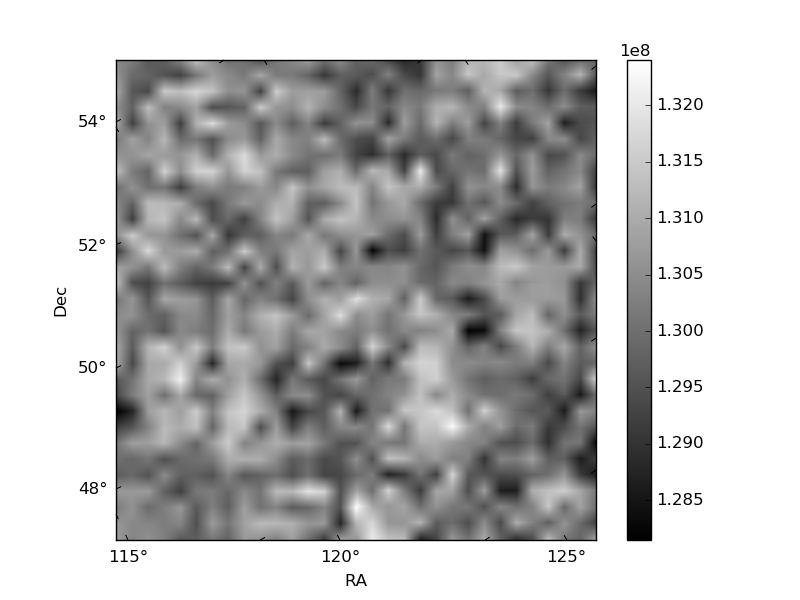
Histogram calculated using DETX and DETY for each event in the final _common_clean file
| Quadrant A |  |
 |
Quadrant B |
|---|---|---|---|
| Quadrant D |  |
 |
Quadrant C |
| Plot type | Count rate plots | Images |
|---|---|---|
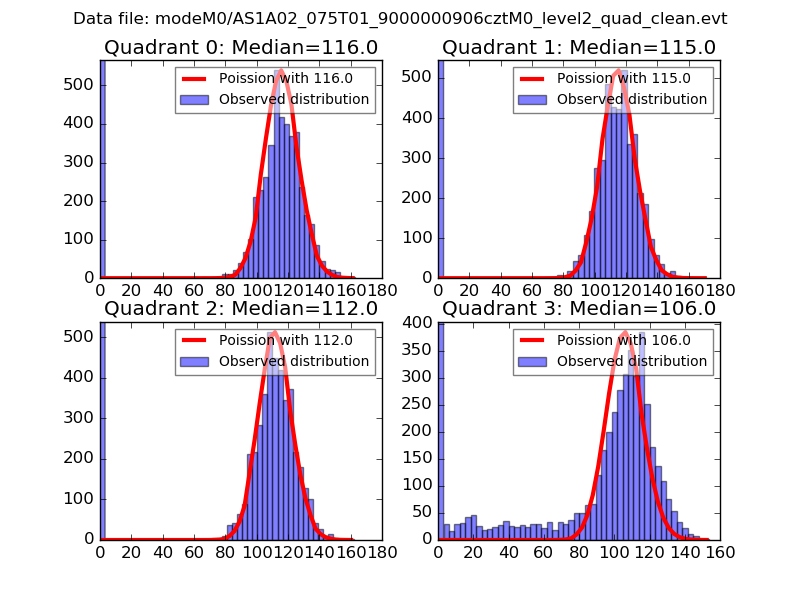
| Comparison with Poisson distribution Blue bars denote a histogram of data divided into 1 sec bins. Red curve is a Poisson curve with rate = median count rate of data. |
 |
 |
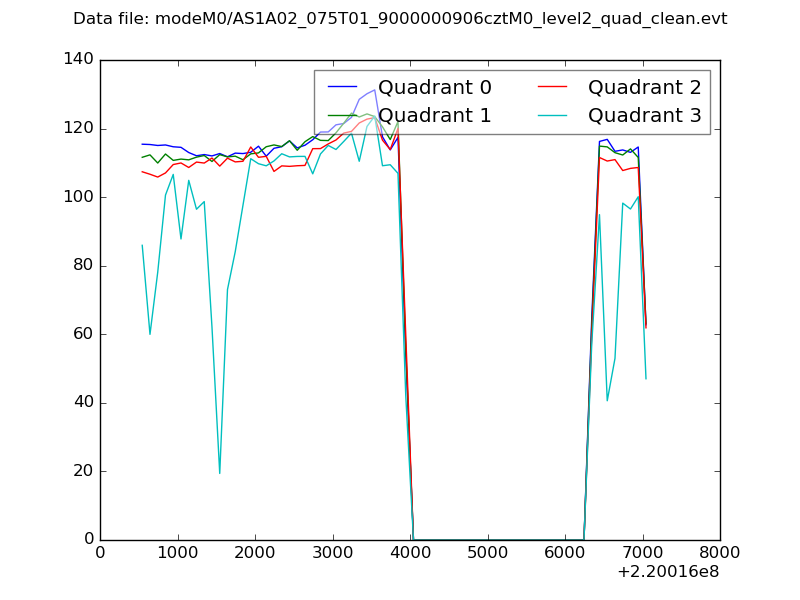
| Quadrant-wise count rates Data is divided into 100 sec bins |
 |
|
| Module-wise count rates for Quadrant A Data is divided into 100 sec bins |
 |
 |
| Module-wise count rates for Quadrant B Data is divided into 100 sec bins |
 |
 |
| Module-wise count rates for Quadrant C Data is divided into 100 sec bins |
 |
 |
| Module-wise count rates for Quadrant D Data is divided into 100 sec bins |
 |
 |
| Parameter | Plot |
|---|---|
| CZT HV Monitor |  |
| D_VDD |  |
| Temperature 1 |  |
| Veto HV Monitor |  |
| Veto LLD |  |
| Alpha Counter |  |
| _CPM_Rate |  |
| CZT Counter |  |
| +2.5 Volts monitor |  |
| +5 Volts monitor |  |
| _ROLL_ROT |  |
| _Roll_DEC | 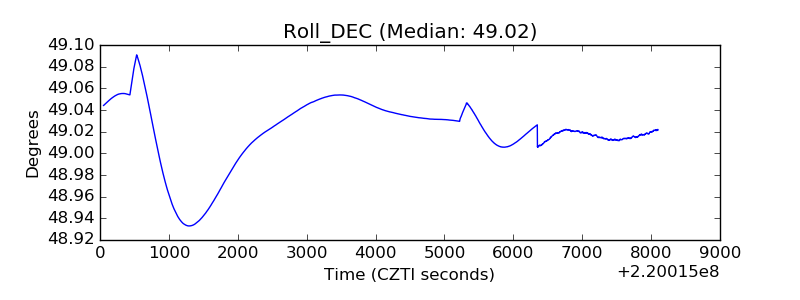 |
| _Roll_RA |  |
| Veto Counter | 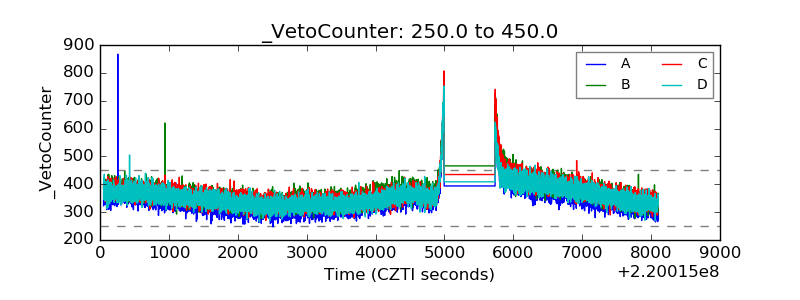 |