| Param | Original file | Final file |
|---|---|---|
| Filename | modeM0/AS1A02_103T01_9000000904cztM0_level2.evt | modeM0/AS1A02_103T01_9000000904cztM0_level2_quad_clean.evt |
| Size (bytes) | 6,309,253,440 | 937,042,560 |
| Size | 5.9 GB | 893.6 MB |
| Events in quadrant A | 40,850,876 | 5,845,056 |
| Events in quadrant B | 37,272,017 | 6,042,024 |
| Events in quadrant C | 38,533,699 | 5,857,005 |
| Events in quadrant D | 69,262,523 | 5,385,916 |
| Mode M9 | |||
|---|---|---|---|
| Quadrant | BADHDUFLAG | Total packets | Discarded packets |
| A | 0 | 112 | 0 |
| B | 0 | 112 | 0 |
| C | 0 | 112 | 0 |
| D | 0 | 112 | 0 |
| Mode M0 | |||
|---|---|---|---|
| Quadrant | BADHDUFLAG | Total packets | Discarded packets |
| A | 0 | 172732 | 0 |
| B | 0 | 161985 | 0 |
| C | 0 | 168147 | 0 |
| D | 0 | 258562 | 0 |
| Mode SS | |||
|---|---|---|---|
| Quadrant | BADHDUFLAG | Total packets | Discarded packets |
| A | 0 | 1556 | 0 |
| B | 0 | 1556 | 0 |
| C | 0 | 1556 | 0 |
| D | 0 | 1556 | 0 |
| Quadrant | Total seconds | Saturated seconds | Saturation percentage |
|---|---|---|---|
| A | 76559 | 2822 | 3.686046% |
| B | 76560 | 1296 | 1.692790% |
| C | 76559 | 1914 | 2.500033% |
| D | 76555 | 10529 | 13.753511% |
Noise dominated data is calculated using 1-second bins in cleaned event files. If a bin has >2000 counts, and if more than 50% of those come from <1% of pixels, then it is considered to be noise-dominated and hence unusable.
| Quadrant | # 1 sec bins | Bins with >0 counts | Bins with >2000 counts | High rate bins dominated by noise | Noise dominated (total time) | Noise dominated (detector-on time) | Marked lightcurve |
|---|---|---|---|---|---|---|---|
| A | 87681 | 76582 | 1090 | 1090 | 1.24% | 1.42% |  |
| B | 87681 | 76583 | 72 | 72 | 0.08% | 0.09% |  |
| C | 87681 | 76582 | 800 | 800 | 0.91% | 1.04% |  |
| D | 87681 | 76583 | 7465 | 7465 | 8.51% | 9.75% |  |
Top three noisy pixels from each quadrant. If the there are fewer than three noisy pixels in the level2.evt file, extra rows are filled as -1
| Pixel properties | Quadrant properties | ||||||
|---|---|---|---|---|---|---|---|
| Quadrant | DetID | PixID | Counts | Sigma | Mean | Median | Sigma |
| A | 14 | 111 | 2947539 | 1627.82 | 8967 | 8765 | 1805.3 |
| A | 8 | 15 | 2535687 | 1399.69 | 8967 | 8765 | 1805.3 |
| A | 15 | 236 | 386186 | 209.06 | 8967 | 8765 | 1805.3 |
| B | 0 | 228 | 345146 | 193.13 | 9134 | 8914 | 1741.0 |
| B | 0 | 214 | 341071 | 190.79 | 9134 | 8914 | 1741.0 |
| B | 4 | 81 | 332833 | 186.06 | 9134 | 8914 | 1741.0 |
| C | 9 | 247 | 4161212 | 2061.72 | 8749 | 8789 | 2014.1 |
| C | 4 | 254 | 143713 | 66.99 | 8749 | 8789 | 2014.1 |
| C | 13 | 61 | 68568 | 29.68 | 8749 | 8789 | 2014.1 |
| D | 2 | 33 | 23417658 | 11602.86 | 8264 | 8026 | 2017.6 |
| D | 8 | 195 | 5794487 | 2868.03 | 8264 | 8026 | 2017.6 |
| D | 12 | 221 | 3192254 | 1578.25 | 8264 | 8026 | 2017.6 |
Histogram calculated using DETX and DETY for each event in the final _common_clean file
| Quadrant A |  |
 |
Quadrant B |
|---|---|---|---|
| Quadrant D |  |
 |
Quadrant C |
| Plot type | Count rate plots | Images |
|---|---|---|
| Comparison with Poisson distribution Blue bars denote a histogram of data divided into 1 sec bins. Red curve is a Poisson curve with rate = median count rate of data. |
 |
 |
| Quadrant-wise count rates Data is divided into 100 sec bins |
 |
|
| Module-wise count rates for Quadrant A Data is divided into 100 sec bins |
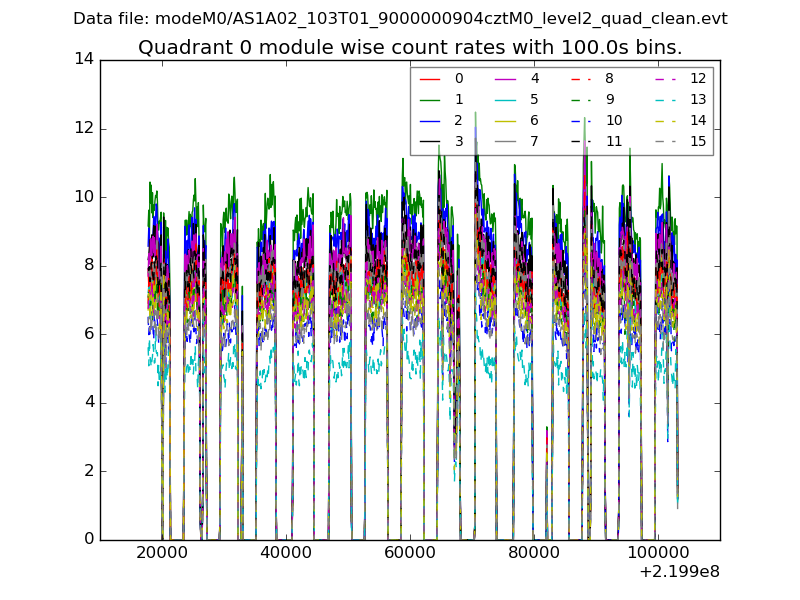 |
 |
| Module-wise count rates for Quadrant B Data is divided into 100 sec bins |
 |
 |
| Module-wise count rates for Quadrant C Data is divided into 100 sec bins |
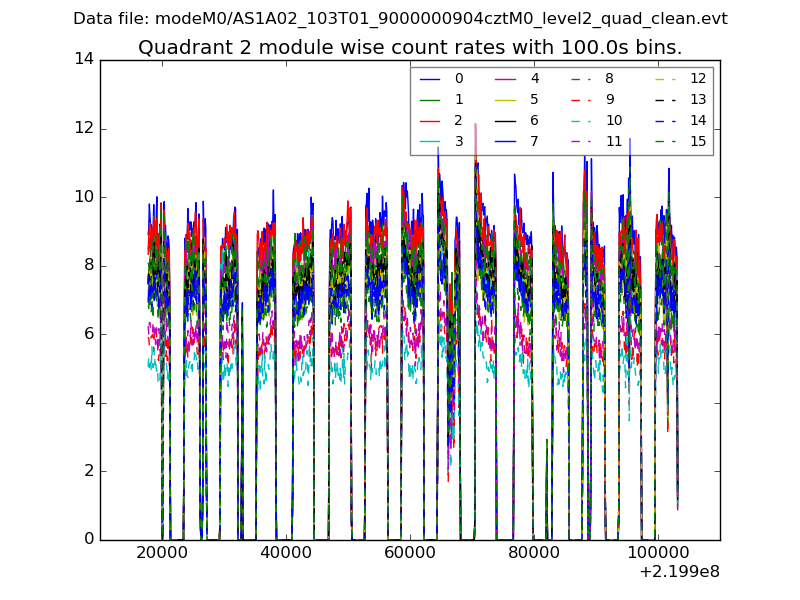 |
 |
| Module-wise count rates for Quadrant D Data is divided into 100 sec bins |
 |
 |
| Parameter | Plot |
|---|---|
| CZT HV Monitor |  |
| D_VDD |  |
| Temperature 1 |  |
| Veto HV Monitor |  |
| Veto LLD |  |
| Alpha Counter |  |
| _CPM_Rate |  |
| CZT Counter |  |
| +2.5 Volts monitor |  |
| +5 Volts monitor |  |
| _ROLL_ROT |  |
| _Roll_DEC |  |
| _Roll_RA | 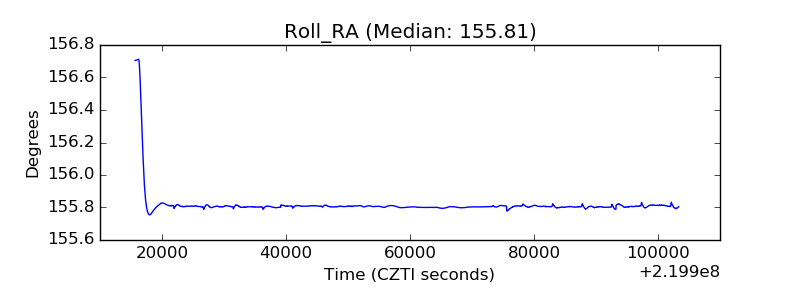 |
| Veto Counter |  |