| Param | Original file | Final file |
|---|---|---|
| Filename | modeM0/AS1A02_189T01_9000000902cztM0_level2.evt | modeM0/AS1A02_189T01_9000000902cztM0_level2_quad_clean.evt |
| Size (bytes) | 2,929,518,720 | 561,150,720 |
| Size | 2.7 GB | 535.2 MB |
| Events in quadrant A | 20,395,298 | 3,648,426 |
| Events in quadrant B | 20,019,499 | 3,699,744 |
| Events in quadrant C | 16,407,430 | 3,689,739 |
| Events in quadrant D | 29,365,204 | 3,378,598 |
| Mode M9 | |||
|---|---|---|---|
| Quadrant | BADHDUFLAG | Total packets | Discarded packets |
| A | 0 | 63 | 0 |
| B | 0 | 63 | 0 |
| C | 0 | 63 | 0 |
| D | 0 | 63 | 0 |
| Mode SS | |||
|---|---|---|---|
| Quadrant | BADHDUFLAG | Total packets | Discarded packets |
| A | 0 | 768 | 0 |
| B | 0 | 768 | 0 |
| C | 0 | 762 | 0 |
| D | 0 | 764 | 0 |
| Mode M0 | |||
|---|---|---|---|
| Quadrant | BADHDUFLAG | Total packets | Discarded packets |
| A | 0 | 85498 | 0 |
| B | 0 | 85952 | 0 |
| C | 0 | 77020 | 0 |
| D | 0 | 114003 | 0 |
| Quadrant | Total seconds | Saturated seconds | Saturation percentage |
|---|---|---|---|
| A | 37575 | 698 | 1.857618% |
| B | 37573 | 1263 | 3.361456% |
| C | 37588 | 256 | 0.681068% |
| D | 37523 | 2944 | 7.845855% |
Noise dominated data is calculated using 1-second bins in cleaned event files. If a bin has >2000 counts, and if more than 50% of those come from <1% of pixels, then it is considered to be noise-dominated and hence unusable.
| Quadrant | # 1 sec bins | Bins with >0 counts | Bins with >2000 counts | High rate bins dominated by noise | Noise dominated (total time) | Noise dominated (detector-on time) | Marked lightcurve |
|---|---|---|---|---|---|---|---|
| A | 44123 | 37707 | 171 | 171 | 0.39% | 0.45% |  |
| B | 44123 | 37694 | 662 | 662 | 1.50% | 1.76% |  |
| C | 44123 | 37720 | 28 | 28 | 0.06% | 0.07% |  |
| D | 44123 | 37654 | 2085 | 2085 | 4.73% | 5.54% |  |
Top three noisy pixels from each quadrant. If the there are fewer than three noisy pixels in the level2.evt file, extra rows are filled as -1
| Pixel properties | Quadrant properties | ||||||
|---|---|---|---|---|---|---|---|
| Quadrant | DetID | PixID | Counts | Sigma | Mean | Median | Sigma |
| A | 8 | 15 | 2160809 | 2542.84 | 4263 | 4174 | 848.1 |
| A | 15 | 239 | 1663320 | 1956.27 | 4263 | 4174 | 848.1 |
| A | 13 | 248 | 55823 | 60.9 | 4263 | 4174 | 848.1 |
| B | 0 | 228 | 2625985 | 3306.44 | 4291 | 4192 | 792.9 |
| B | 4 | 170 | 155721 | 191.1 | 4291 | 4192 | 792.9 |
| B | 0 | 214 | 135298 | 165.34 | 4291 | 4192 | 792.9 |
| C | 9 | 247 | 157197 | 162.63 | 4149 | 4163 | 941.0 |
| C | 13 | 61 | 33368 | 31.04 | 4149 | 4163 | 941.0 |
| C | 8 | 128 | 21125 | 18.02 | 4149 | 4163 | 941.0 |
| D | 2 | 33 | 7129015 | 7377.26 | 3993 | 3868 | 965.8 |
| D | 2 | 152 | 2648845 | 2738.57 | 3993 | 3868 | 965.8 |
| D | 8 | 195 | 2287809 | 2364.76 | 3993 | 3868 | 965.8 |
Histogram calculated using DETX and DETY for each event in the final _common_clean file
| Quadrant A |  |
 |
Quadrant B |
|---|---|---|---|
| Quadrant D | 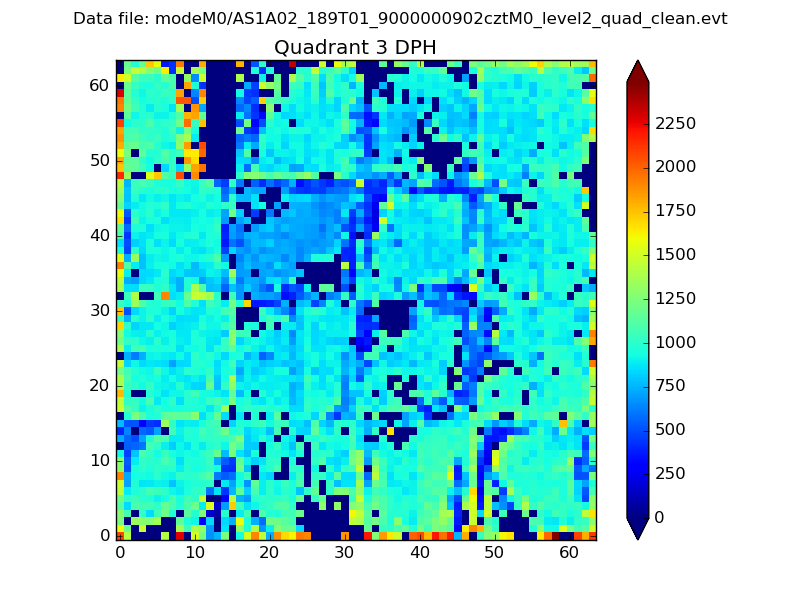 |
 |
Quadrant C |
| Plot type | Count rate plots | Images |
|---|---|---|
| Comparison with Poisson distribution Blue bars denote a histogram of data divided into 1 sec bins. Red curve is a Poisson curve with rate = median count rate of data. |
 |
 |
| Quadrant-wise count rates Data is divided into 100 sec bins |
 |
|
| Module-wise count rates for Quadrant A Data is divided into 100 sec bins |
 |
 |
| Module-wise count rates for Quadrant B Data is divided into 100 sec bins |
 |
 |
| Module-wise count rates for Quadrant C Data is divided into 100 sec bins |
 |
 |
| Module-wise count rates for Quadrant D Data is divided into 100 sec bins |
 |
 |
| Parameter | Plot |
|---|---|
| CZT HV Monitor |  |
| D_VDD |  |
| Temperature 1 |  |
| Veto HV Monitor |  |
| Veto LLD | 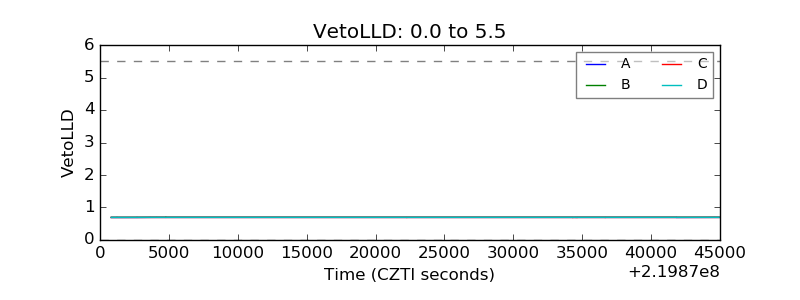 |
| Alpha Counter |  |
| _CPM_Rate |  |
| CZT Counter | 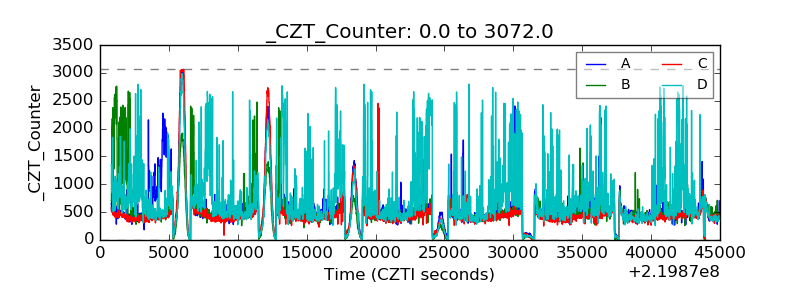 |
| +2.5 Volts monitor |  |
| +5 Volts monitor |  |
| _ROLL_ROT |  |
| _Roll_DEC |  |
| _Roll_RA |  |
| Veto Counter |  |