| Param | Original file | Final file |
|---|---|---|
| Filename | modeM0/AS1A02_111T01_9000000900cztM0_level2.evt | modeM0/AS1A02_111T01_9000000900cztM0_level2_quad_clean.evt |
| Size (bytes) | 1,937,136,960 | 337,613,760 |
| Size | 1.8 GB | 322.0 MB |
| Events in quadrant A | 11,318,966 | 2,210,573 |
| Events in quadrant B | 12,155,047 | 2,229,241 |
| Events in quadrant C | 10,205,993 | 2,203,762 |
| Events in quadrant D | 23,412,035 | 1,974,204 |
| Mode M0 | |||
|---|---|---|---|
| Quadrant | BADHDUFLAG | Total packets | Discarded packets |
| A | 0 | 50274 | 0 |
| B | 0 | 52059 | 0 |
| C | 0 | 47484 | 0 |
| D | 0 | 86172 | 0 |
| Mode M9 | |||
|---|---|---|---|
| Quadrant | BADHDUFLAG | Total packets | Discarded packets |
| A | 0 | 38 | 0 |
| B | 0 | 38 | 0 |
| C | 0 | 38 | 0 |
| D | 0 | 38 | 0 |
| Mode SS | |||
|---|---|---|---|
| Quadrant | BADHDUFLAG | Total packets | Discarded packets |
| A | 0 | 474 | 0 |
| B | 0 | 474 | 0 |
| C | 0 | 474 | 0 |
| D | 0 | 474 | 0 |
| Quadrant | Total seconds | Saturated seconds | Saturation percentage |
|---|---|---|---|
| A | 23369 | 456 | 1.951303% |
| B | 23369 | 529 | 2.263683% |
| C | 23369 | 213 | 0.911464% |
| D | 23369 | 2152 | 9.208781% |
Noise dominated data is calculated using 1-second bins in cleaned event files. If a bin has >2000 counts, and if more than 50% of those come from <1% of pixels, then it is considered to be noise-dominated and hence unusable.
| Quadrant | # 1 sec bins | Bins with >0 counts | Bins with >2000 counts | High rate bins dominated by noise | Noise dominated (total time) | Noise dominated (detector-on time) | Marked lightcurve |
|---|---|---|---|---|---|---|---|
| A | 26594 | 23372 | 65 | 65 | 0.24% | 0.28% |  |
| B | 26594 | 23373 | 130 | 130 | 0.49% | 0.56% |  |
| C | 26594 | 23373 | 0 | 0 | 0.00% | 0.00% |  |
| D | 26594 | 23373 | 1575 | 1575 | 5.92% | 6.74% |  |
Top three noisy pixels from each quadrant. If the there are fewer than three noisy pixels in the level2.evt file, extra rows are filled as -1
| Pixel properties | Quadrant properties | ||||||
|---|---|---|---|---|---|---|---|
| Quadrant | DetID | PixID | Counts | Sigma | Mean | Median | Sigma |
| A | 15 | 239 | 719740 | 1333.07 | 2663 | 2599 | 538.0 |
| A | 13 | 248 | 219274 | 402.77 | 2663 | 2599 | 538.0 |
| A | 8 | 15 | 86372 | 155.72 | 2663 | 2599 | 538.0 |
| B | 0 | 219 | 526599 | 1040.94 | 2689 | 2625 | 503.4 |
| B | 4 | 48 | 384783 | 759.21 | 2689 | 2625 | 503.4 |
| B | 0 | 228 | 323424 | 637.31 | 2689 | 2625 | 503.4 |
| C | 13 | 61 | 20764 | 30.3 | 2606 | 2619 | 598.9 |
| C | 8 | 128 | 19366 | 27.96 | 2606 | 2619 | 598.9 |
| C | 8 | 112 | 10892 | 13.81 | 2606 | 2619 | 598.9 |
| D | 8 | 195 | 7877234 | 12910.38 | 2506 | 2423 | 610.0 |
| D | 2 | 33 | 4162466 | 6820.19 | 2506 | 2423 | 610.0 |
| D | 2 | 63 | 337280 | 548.98 | 2506 | 2423 | 610.0 |
Histogram calculated using DETX and DETY for each event in the final _common_clean file
| Quadrant A |  |
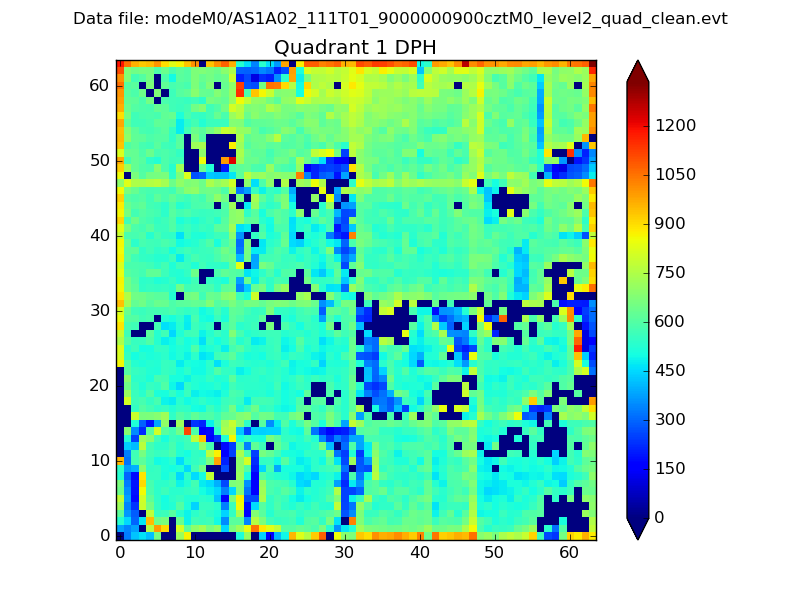 |
Quadrant B |
|---|---|---|---|
| Quadrant D |  |
 |
Quadrant C |
| Plot type | Count rate plots | Images |
|---|---|---|
| Comparison with Poisson distribution Blue bars denote a histogram of data divided into 1 sec bins. Red curve is a Poisson curve with rate = median count rate of data. |
 |
 |
| Quadrant-wise count rates Data is divided into 100 sec bins |
 |
|
| Module-wise count rates for Quadrant A Data is divided into 100 sec bins |
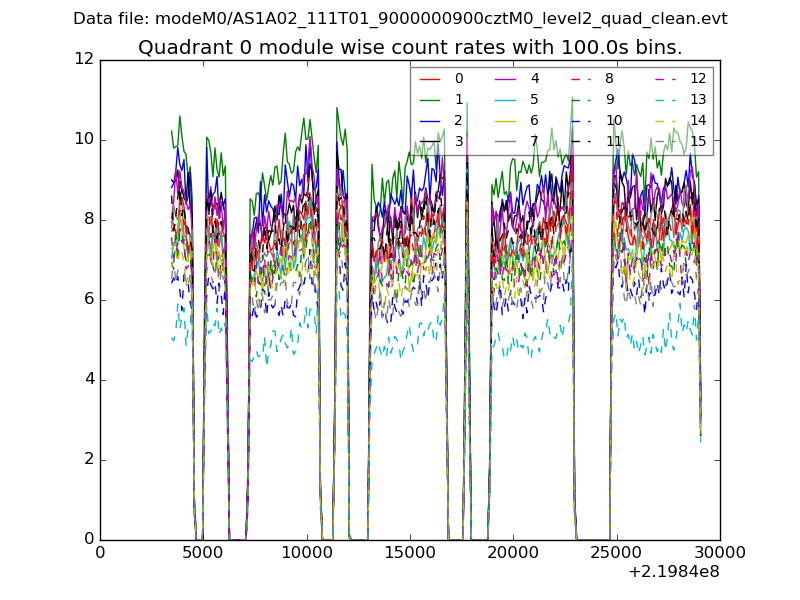 |
 |
| Module-wise count rates for Quadrant B Data is divided into 100 sec bins |
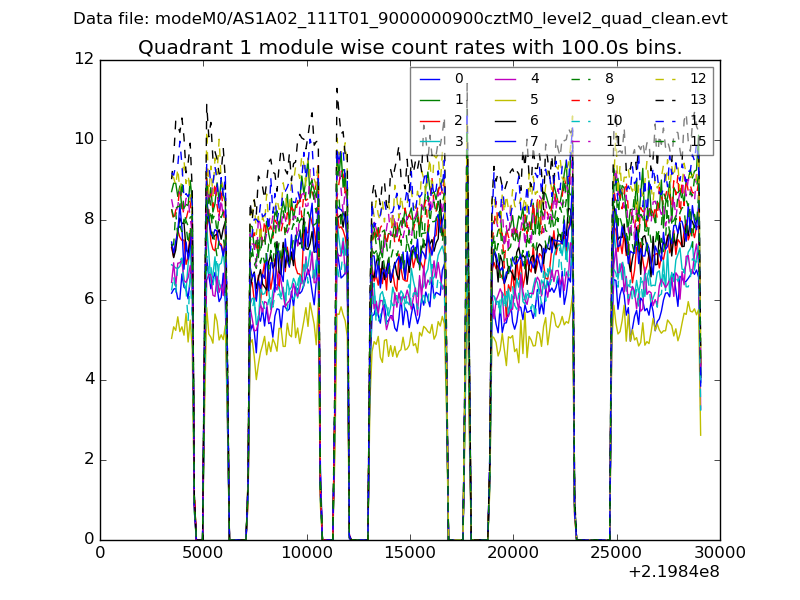 |
 |
| Module-wise count rates for Quadrant C Data is divided into 100 sec bins |
 |
 |
| Module-wise count rates for Quadrant D Data is divided into 100 sec bins |
 |
 |
| Parameter | Plot |
|---|---|
| CZT HV Monitor | 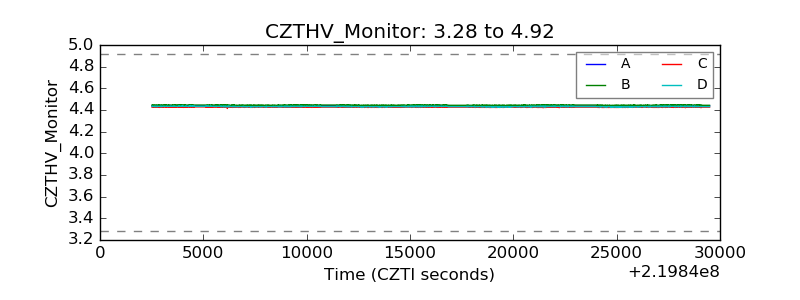 |
| D_VDD |  |
| Temperature 1 |  |
| Veto HV Monitor |  |
| Veto LLD |  |
| Alpha Counter |  |
| _CPM_Rate |  |
| CZT Counter | 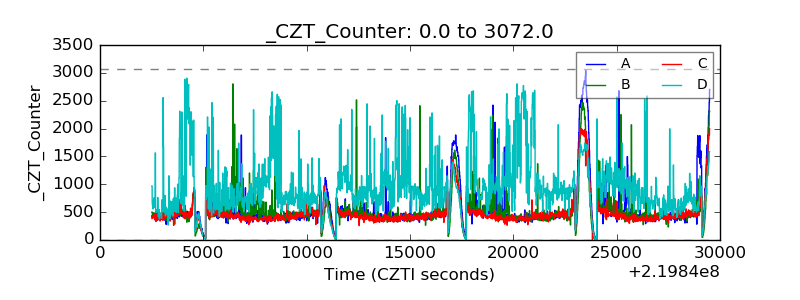 |
| +2.5 Volts monitor |  |
| +5 Volts monitor |  |
| _ROLL_ROT | 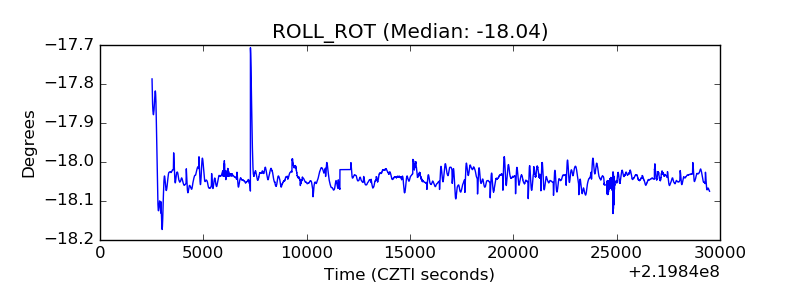 |
| _Roll_DEC |  |
| _Roll_RA |  |
| Veto Counter |  |