| Param | Original file | Final file |
|---|---|---|
| Filename | modeM0/AS1G06_164T01_9000000896cztM0_level2.evt | modeM0/AS1G06_164T01_9000000896cztM0_level2_quad_clean.evt |
| Size (bytes) | 1,191,654,720 | 216,253,440 |
| Size | 1.1 GB | 206.2 MB |
| Events in quadrant A | 7,374,023 | 1,379,262 |
| Events in quadrant B | 8,547,213 | 1,367,244 |
| Events in quadrant C | 7,429,544 | 1,348,597 |
| Events in quadrant D | 11,606,726 | 1,299,853 |
| Mode M0 | |||
|---|---|---|---|
| Quadrant | BADHDUFLAG | Total packets | Discarded packets |
| A | 0 | 33885 | 0 |
| B | 0 | 36709 | 0 |
| C | 0 | 34532 | 0 |
| D | 0 | 46145 | 0 |
| Mode M9 | |||
|---|---|---|---|
| Quadrant | BADHDUFLAG | Total packets | Discarded packets |
| A | 1 | 251318637792 | 0 |
| B | 1 | 251318637792 | 0 |
| C | 1 | 251318637792 | 0 |
| D | 1 | 251318637792 | 0 |
| Mode SS | |||
|---|---|---|---|
| Quadrant | BADHDUFLAG | Total packets | Discarded packets |
| A | 0 | 340 | 0 |
| B | 0 | 338 | 0 |
| C | 0 | 340 | 0 |
| D | 0 | 338 | 0 |
| Quadrant | Total seconds | Saturated seconds | Saturation percentage |
|---|---|---|---|
| A | 16740 | 97 | 0.579450% |
| B | 16743 | 256 | 1.528997% |
| C | 16738 | 137 | 0.818497% |
| D | 16737 | 291 | 1.738663% |
Noise dominated data is calculated using 1-second bins in cleaned event files. If a bin has >2000 counts, and if more than 50% of those come from <1% of pixels, then it is considered to be noise-dominated and hence unusable.
| Quadrant | # 1 sec bins | Bins with >0 counts | Bins with >2000 counts | High rate bins dominated by noise | Noise dominated (total time) | Noise dominated (detector-on time) | Marked lightcurve |
|---|---|---|---|---|---|---|---|
| A | 17903 | 16766 | 3 | 3 | 0.02% | 0.02% | 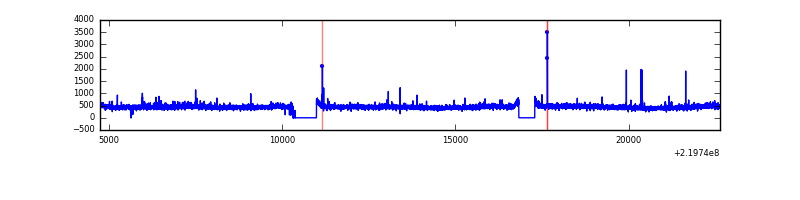 |
| B | 17903 | 16771 | 91 | 91 | 0.51% | 0.54% |  |
| C | 17903 | 16763 | 61 | 61 | 0.34% | 0.36% |  |
| D | 17903 | 16772 | 178 | 178 | 0.99% | 1.06% |  |
Top three noisy pixels from each quadrant. If the there are fewer than three noisy pixels in the level2.evt file, extra rows are filled as -1
| Pixel properties | Quadrant properties | ||||||
|---|---|---|---|---|---|---|---|
| Quadrant | DetID | PixID | Counts | Sigma | Mean | Median | Sigma |
| A | 8 | 15 | 75523 | 192.61 | 1881 | 1838 | 382.6 |
| A | 14 | 111 | 34073 | 84.26 | 1881 | 1838 | 382.6 |
| A | 13 | 251 | 19625 | 46.49 | 1881 | 1838 | 382.6 |
| B | 4 | 48 | 298451 | 828.04 | 1888 | 1840 | 358.2 |
| B | 15 | 204 | 280973 | 779.25 | 1888 | 1840 | 358.2 |
| B | 0 | 219 | 230213 | 637.54 | 1888 | 1840 | 358.2 |
| C | 9 | 54 | 312291 | 743.45 | 1813 | 1818 | 417.6 |
| C | 1 | 16 | 23180 | 51.15 | 1813 | 1818 | 417.6 |
| C | 13 | 61 | 14497 | 30.36 | 1813 | 1818 | 417.6 |
| D | 8 | 195 | 3314739 | 7526.41 | 1811 | 1754 | 440.2 |
| D | 2 | 33 | 566831 | 1283.74 | 1811 | 1754 | 440.2 |
| D | 14 | 34 | 422303 | 955.4 | 1811 | 1754 | 440.2 |
Histogram calculated using DETX and DETY for each event in the final _common_clean file
| Quadrant A |  |
 |
Quadrant B |
|---|---|---|---|
| Quadrant D |  |
 |
Quadrant C |
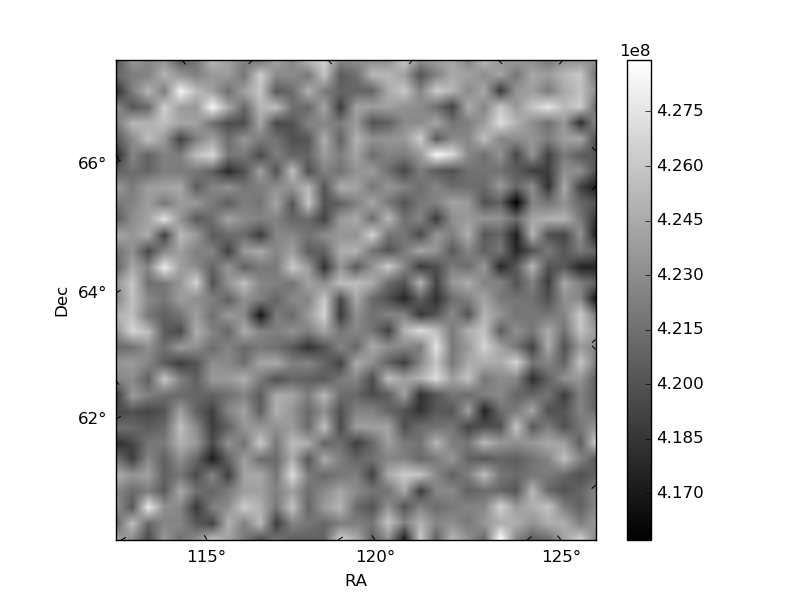
| Plot type | Count rate plots | Images |
|---|---|---|
| Comparison with Poisson distribution Blue bars denote a histogram of data divided into 1 sec bins. Red curve is a Poisson curve with rate = median count rate of data. |
 |
 |
| Quadrant-wise count rates Data is divided into 100 sec bins |
 |
|
| Module-wise count rates for Quadrant A Data is divided into 100 sec bins |
 |
 |
| Module-wise count rates for Quadrant B Data is divided into 100 sec bins |
 |
 |
| Module-wise count rates for Quadrant C Data is divided into 100 sec bins |
 |
 |
| Module-wise count rates for Quadrant D Data is divided into 100 sec bins |
 |
 |
| Parameter | Plot |
|---|---|
| CZT HV Monitor |  |
| D_VDD |  |
| Temperature 1 |  |
| Veto HV Monitor |  |
| Veto LLD |  |
| Alpha Counter |  |
| _CPM_Rate | 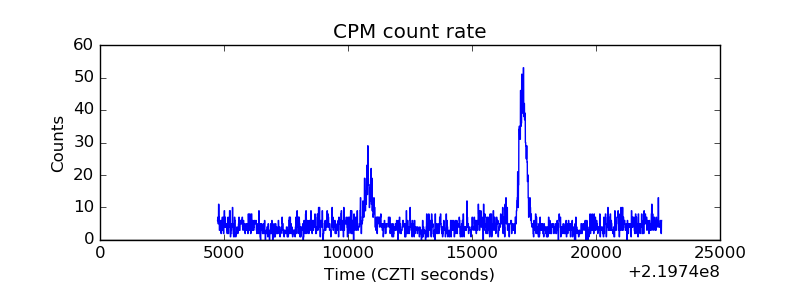 |
| CZT Counter |  |
| +2.5 Volts monitor |  |
| +5 Volts monitor |  |
| _ROLL_ROT |  |
| _Roll_DEC |  |
| _Roll_RA |  |
| Veto Counter |  |