| Param | Original file | Final file |
|---|---|---|
| Filename | modeM0/AS1A02_082T01_9000000898cztM0_level2.evt | modeM0/AS1A02_082T01_9000000898cztM0_level2_quad_clean.evt |
| Size (bytes) | 4,925,761,920 | 797,826,240 |
| Size | 4.6 GB | 760.9 MB |
| Events in quadrant A | 31,702,821 | 4,984,707 |
| Events in quadrant B | 33,443,844 | 4,985,426 |
| Events in quadrant C | 30,674,575 | 4,890,138 |
| Events in quadrant D | 48,811,311 | 4,682,173 |
| Mode SS | |||
|---|---|---|---|
| Quadrant | BADHDUFLAG | Total packets | Discarded packets |
| A | 0 | 1372 | 0 |
| B | 0 | 1372 | 0 |
| C | 0 | 1372 | 0 |
| D | 0 | 1372 | 0 |
| Mode M0 | |||
|---|---|---|---|
| Quadrant | BADHDUFLAG | Total packets | Discarded packets |
| A | 0 | 140220 | 0 |
| B | 0 | 144072 | 0 |
| C | 0 | 138644 | 0 |
| D | 0 | 191866 | 0 |
| Mode M9 | |||
|---|---|---|---|
| Quadrant | BADHDUFLAG | Total packets | Discarded packets |
| A | 0 | 100 | 0 |
| B | 0 | 100 | 0 |
| C | 0 | 100 | 0 |
| D | 0 | 100 | 0 |
| Quadrant | Total seconds | Saturated seconds | Saturation percentage |
|---|---|---|---|
| A | 67399 | 1131 | 1.678066% |
| B | 67399 | 1381 | 2.048992% |
| C | 67399 | 859 | 1.274500% |
| D | 67399 | 2838 | 4.210745% |
Noise dominated data is calculated using 1-second bins in cleaned event files. If a bin has >2000 counts, and if more than 50% of those come from <1% of pixels, then it is considered to be noise-dominated and hence unusable.
| Quadrant | # 1 sec bins | Bins with >0 counts | Bins with >2000 counts | High rate bins dominated by noise | Noise dominated (total time) | Noise dominated (detector-on time) | Marked lightcurve |
|---|---|---|---|---|---|---|---|
| A | 77499 | 67412 | 9 | 9 | 0.01% | 0.01% | 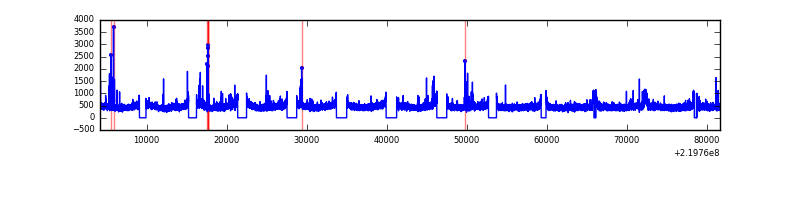 |
| B | 77499 | 67412 | 182 | 182 | 0.23% | 0.27% | 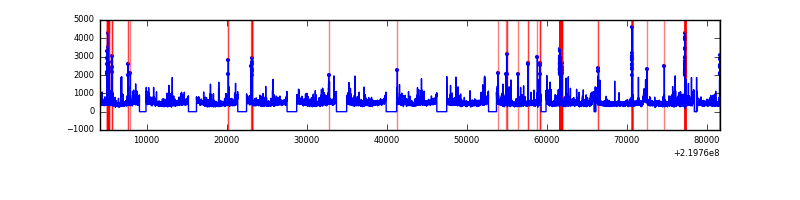 |
| C | 77499 | 67412 | 0 | 0 | 0.00% | 0.00% |  |
| D | 77499 | 67412 | 1407 | 1407 | 1.82% | 2.09% |  |
Top three noisy pixels from each quadrant. If the there are fewer than three noisy pixels in the level2.evt file, extra rows are filled as -1
| Pixel properties | Quadrant properties | ||||||
|---|---|---|---|---|---|---|---|
| Quadrant | DetID | PixID | Counts | Sigma | Mean | Median | Sigma |
| A | 8 | 15 | 640577 | 394.21 | 7997 | 7830 | 1605.1 |
| A | 14 | 111 | 197441 | 118.13 | 7997 | 7830 | 1605.1 |
| A | 0 | 226 | 75423 | 42.11 | 7997 | 7830 | 1605.1 |
| B | 0 | 219 | 1116044 | 718.93 | 8058 | 7855 | 1541.4 |
| B | 4 | 81 | 666650 | 427.39 | 8058 | 7855 | 1541.4 |
| B | 4 | 48 | 184391 | 114.53 | 8058 | 7855 | 1541.4 |
| C | 8 | 128 | 67823 | 33.07 | 7813 | 7848 | 1813.3 |
| C | 13 | 61 | 61130 | 29.38 | 7813 | 7848 | 1813.3 |
| C | 12 | 4 | 59610 | 28.54 | 7813 | 7848 | 1813.3 |
| D | 8 | 195 | 11231071 | 6028.08 | 7697 | 7476 | 1861.9 |
| D | 2 | 33 | 5412234 | 2902.84 | 7697 | 7476 | 1861.9 |
| D | 2 | 16 | 1290910 | 689.32 | 7697 | 7476 | 1861.9 |
Histogram calculated using DETX and DETY for each event in the final _common_clean file
| Quadrant A |  |
 |
Quadrant B |
|---|---|---|---|
| Quadrant D |  |
 |
Quadrant C |
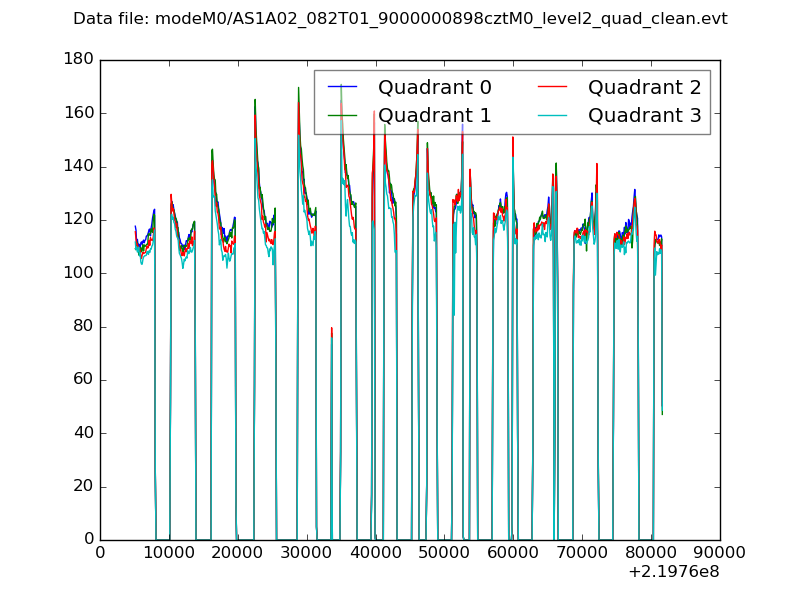
| Plot type | Count rate plots | Images |
|---|---|---|
| Comparison with Poisson distribution Blue bars denote a histogram of data divided into 1 sec bins. Red curve is a Poisson curve with rate = median count rate of data. |
 |
 |
| Quadrant-wise count rates Data is divided into 100 sec bins |
 |
|
| Module-wise count rates for Quadrant A Data is divided into 100 sec bins |
 |
 |
| Module-wise count rates for Quadrant B Data is divided into 100 sec bins |
 |
 |
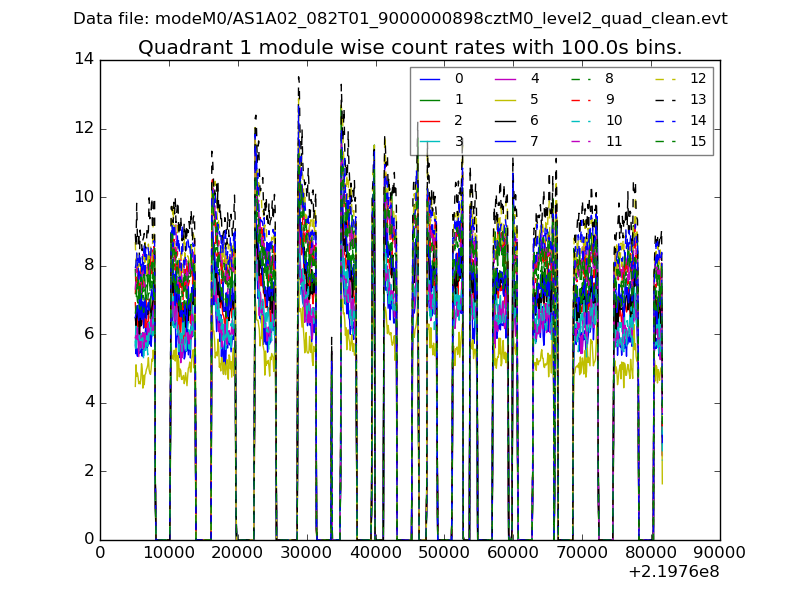
| Module-wise count rates for Quadrant C Data is divided into 100 sec bins |
 |
 |
| Module-wise count rates for Quadrant D Data is divided into 100 sec bins |
 |
 |
| Parameter | Plot |
|---|---|
| CZT HV Monitor |  |
| D_VDD |  |
| Temperature 1 |  |
| Veto HV Monitor |  |
| Veto LLD |  |
| Alpha Counter |  |
| _CPM_Rate |  |
| CZT Counter | 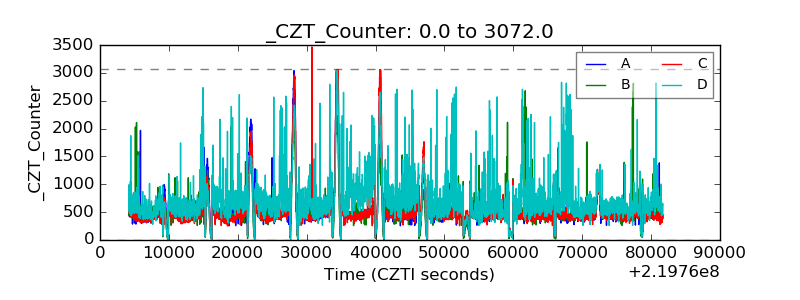 |
| +2.5 Volts monitor |  |
| +5 Volts monitor |  |
| _ROLL_ROT |  |
| _Roll_DEC |  |
| _Roll_RA | 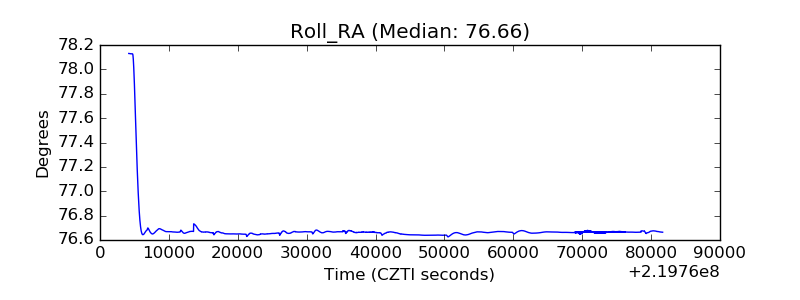 |
| Veto Counter |  |