| Param | Original file | Final file |
|---|---|---|
| Filename | modeM0/AS1G06_134T03_9000000894cztM0_level2.evt | modeM0/AS1G06_134T03_9000000894cztM0_level2_quad_clean.evt |
| Size (bytes) | 1,945,281,600 | 289,918,080 |
| Size | 1.8 GB | 276.5 MB |
| Events in quadrant A | 12,459,708 | 1,815,822 |
| Events in quadrant B | 12,574,072 | 1,834,694 |
| Events in quadrant C | 10,574,525 | 1,817,596 |
| Events in quadrant D | 21,684,124 | 1,657,642 |
| Mode SS | |||
|---|---|---|---|
| Quadrant | BADHDUFLAG | Total packets | Discarded packets |
| A | 0 | 488 | 0 |
| B | 0 | 488 | 0 |
| C | 0 | 488 | 0 |
| D | 0 | 488 | 0 |
| Mode M9 | |||
|---|---|---|---|
| Quadrant | BADHDUFLAG | Total packets | Discarded packets |
| A | 0 | 46 | 0 |
| B | 0 | 46 | 0 |
| C | 0 | 46 | 0 |
| D | 0 | 46 | 0 |
| Mode M0 | |||
|---|---|---|---|
| Quadrant | BADHDUFLAG | Total packets | Discarded packets |
| A | 0 | 53706 | 0 |
| B | 0 | 53605 | 0 |
| C | 0 | 48856 | 0 |
| D | 0 | 81201 | 0 |
| Quadrant | Total seconds | Saturated seconds | Saturation percentage |
|---|---|---|---|
| A | 24061 | 229 | 0.951748% |
| B | 24062 | 432 | 1.795362% |
| C | 24062 | 62 | 0.257668% |
| D | 24061 | 1286 | 5.344749% |
Noise dominated data is calculated using 1-second bins in cleaned event files. If a bin has >2000 counts, and if more than 50% of those come from <1% of pixels, then it is considered to be noise-dominated and hence unusable.
| Quadrant | # 1 sec bins | Bins with >0 counts | Bins with >2000 counts | High rate bins dominated by noise | Noise dominated (total time) | Noise dominated (detector-on time) | Marked lightcurve |
|---|---|---|---|---|---|---|---|
| A | 28522 | 24067 | 68 | 68 | 0.24% | 0.28% |  |
| B | 28523 | 24068 | 179 | 179 | 0.63% | 0.74% |  |
| C | 28523 | 24068 | 4 | 4 | 0.01% | 0.02% | 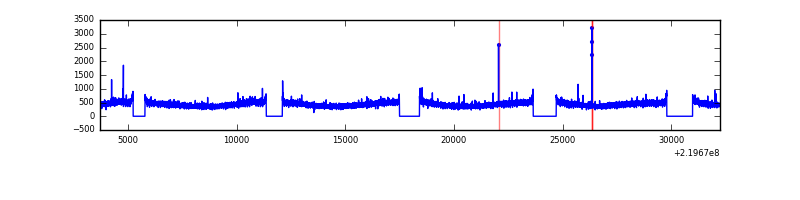 |
| D | 28523 | 24067 | 1162 | 1162 | 4.07% | 4.83% |  |
Top three noisy pixels from each quadrant. If the there are fewer than three noisy pixels in the level2.evt file, extra rows are filled as -1
| Pixel properties | Quadrant properties | ||||||
|---|---|---|---|---|---|---|---|
| Quadrant | DetID | PixID | Counts | Sigma | Mean | Median | Sigma |
| A | 8 | 15 | 1505016 | 2695.45 | 2754 | 2697 | 557.4 |
| A | 13 | 248 | 225358 | 399.5 | 2754 | 2697 | 557.4 |
| A | 14 | 111 | 67379 | 116.05 | 2754 | 2697 | 557.4 |
| B | 0 | 219 | 873298 | 1666.7 | 2784 | 2720 | 522.3 |
| B | 4 | 170 | 171164 | 322.48 | 2784 | 2720 | 522.3 |
| B | 4 | 80 | 169467 | 319.23 | 2784 | 2720 | 522.3 |
| C | 9 | 54 | 28472 | 41.59 | 2684 | 2695 | 619.7 |
| C | 13 | 61 | 21478 | 30.31 | 2684 | 2695 | 619.7 |
| C | 7 | 255 | 20656 | 28.98 | 2684 | 2695 | 619.7 |
| D | 8 | 195 | 6740071 | 10510.07 | 2626 | 2542 | 641.1 |
| D | 12 | 221 | 2145969 | 3343.59 | 2626 | 2542 | 641.1 |
| D | 2 | 33 | 1133593 | 1764.36 | 2626 | 2542 | 641.1 |
Histogram calculated using DETX and DETY for each event in the final _common_clean file
| Quadrant A |  |
 |
Quadrant B |
|---|---|---|---|
| Quadrant D | 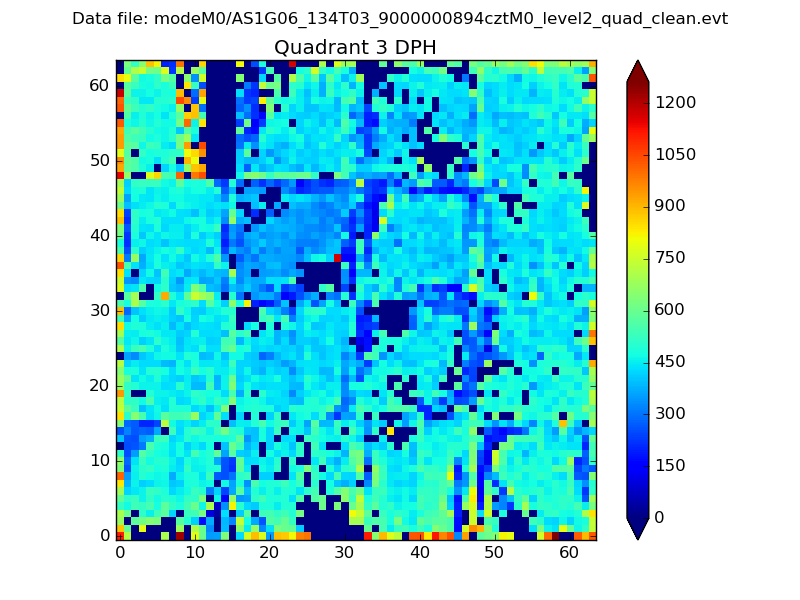 |
 |
Quadrant C |
| Plot type | Count rate plots | Images |
|---|---|---|
| Comparison with Poisson distribution Blue bars denote a histogram of data divided into 1 sec bins. Red curve is a Poisson curve with rate = median count rate of data. |
 |
 |
| Quadrant-wise count rates Data is divided into 100 sec bins |
 |
|
| Module-wise count rates for Quadrant A Data is divided into 100 sec bins |
 |
 |
| Module-wise count rates for Quadrant B Data is divided into 100 sec bins |
 |
 |
| Module-wise count rates for Quadrant C Data is divided into 100 sec bins |
 |
 |
| Module-wise count rates for Quadrant D Data is divided into 100 sec bins |
 |
 |
| Parameter | Plot |
|---|---|
| CZT HV Monitor |  |
| D_VDD |  |
| Temperature 1 |  |
| Veto HV Monitor |  |
| Veto LLD | 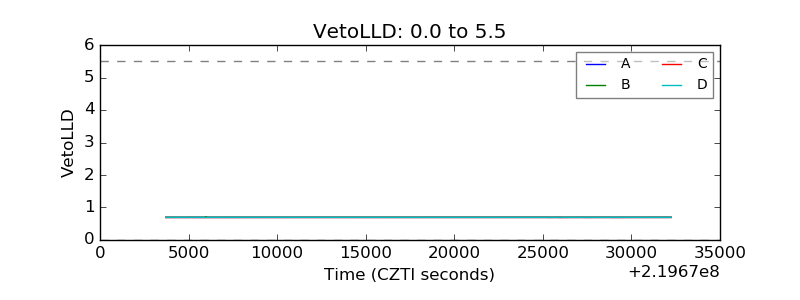 |
| Alpha Counter | 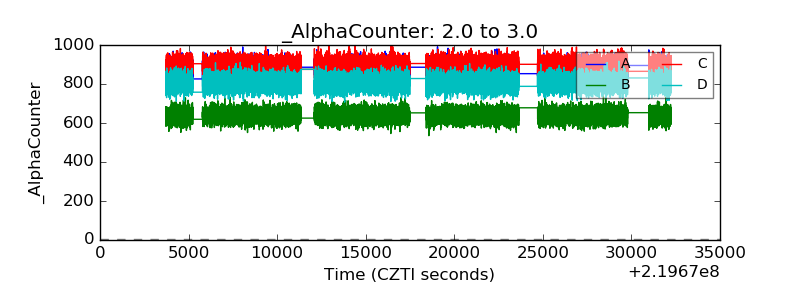 |
| _CPM_Rate |  |
| CZT Counter |  |
| +2.5 Volts monitor |  |
| +5 Volts monitor |  |
| _ROLL_ROT |  |
| _Roll_DEC |  |
| _Roll_RA |  |
| Veto Counter |  |