| Param | Original file | Final file |
|---|---|---|
| Filename | modeM0/AS1A02_170T02_9000000892cztM0_level2.evt | modeM0/AS1A02_170T02_9000000892cztM0_level2_quad_clean.evt |
| Size (bytes) | 2,772,610,560 | 498,836,160 |
| Size | 2.6 GB | 475.7 MB |
| Events in quadrant A | 15,535,279 | 3,270,002 |
| Events in quadrant B | 18,509,479 | 3,267,286 |
| Events in quadrant C | 15,998,116 | 3,228,552 |
| Events in quadrant D | 31,584,252 | 2,956,739 |
| Mode SS | |||
|---|---|---|---|
| Quadrant | BADHDUFLAG | Total packets | Discarded packets |
| A | 0 | 706 | 0 |
| B | 0 | 706 | 0 |
| C | 0 | 706 | 0 |
| D | 0 | 706 | 0 |
| Mode M9 | |||
|---|---|---|---|
| Quadrant | BADHDUFLAG | Total packets | Discarded packets |
| A | 0 | 33 | 0 |
| B | 0 | 33 | 0 |
| C | 0 | 33 | 0 |
| D | 0 | 33 | 0 |
| Mode M0 | |||
|---|---|---|---|
| Quadrant | BADHDUFLAG | Total packets | Discarded packets |
| A | 0 | 71077 | 0 |
| B | 0 | 78527 | 0 |
| C | 0 | 72917 | 0 |
| D | 0 | 118121 | 0 |
| Quadrant | Total seconds | Saturated seconds | Saturation percentage |
|---|---|---|---|
| A | 34725 | 671 | 1.932325% |
| B | 34725 | 1310 | 3.772498% |
| C | 34725 | 439 | 1.264219% |
| D | 34725 | 3051 | 8.786177% |
Noise dominated data is calculated using 1-second bins in cleaned event files. If a bin has >2000 counts, and if more than 50% of those come from <1% of pixels, then it is considered to be noise-dominated and hence unusable.
| Quadrant | # 1 sec bins | Bins with >0 counts | Bins with >2000 counts | High rate bins dominated by noise | Noise dominated (total time) | Noise dominated (detector-on time) | Marked lightcurve |
|---|---|---|---|---|---|---|---|
| A | 38190 | 34733 | 4 | 4 | 0.01% | 0.01% |  |
| B | 38190 | 34733 | 368 | 368 | 0.96% | 1.06% |  |
| C | 38190 | 34733 | 48 | 48 | 0.13% | 0.14% |  |
| D | 38190 | 34732 | 2124 | 2124 | 5.56% | 6.12% |  |
Top three noisy pixels from each quadrant. If the there are fewer than three noisy pixels in the level2.evt file, extra rows are filled as -1
| Pixel properties | Quadrant properties | ||||||
|---|---|---|---|---|---|---|---|
| Quadrant | DetID | PixID | Counts | Sigma | Mean | Median | Sigma |
| A | 8 | 15 | 118879 | 143.97 | 3992 | 3901 | 798.6 |
| A | 0 | 226 | 38758 | 43.64 | 3992 | 3901 | 798.6 |
| A | 12 | 194 | 37961 | 42.65 | 3992 | 3901 | 798.6 |
| B | 0 | 219 | 1064390 | 1423.86 | 3983 | 3882 | 744.8 |
| B | 4 | 48 | 447515 | 595.63 | 3983 | 3882 | 744.8 |
| B | 3 | 220 | 384087 | 510.47 | 3983 | 3882 | 744.8 |
| C | 9 | 247 | 753295 | 843.53 | 3877 | 3878 | 888.4 |
| C | 9 | 54 | 45410 | 46.75 | 3877 | 3878 | 888.4 |
| C | 13 | 61 | 30714 | 30.21 | 3877 | 3878 | 888.4 |
| D | 8 | 195 | 9782761 | 10671.36 | 3781 | 3656 | 916.4 |
| D | 2 | 33 | 1822744 | 1985.06 | 3781 | 3656 | 916.4 |
| D | 2 | 63 | 1604114 | 1746.49 | 3781 | 3656 | 916.4 |
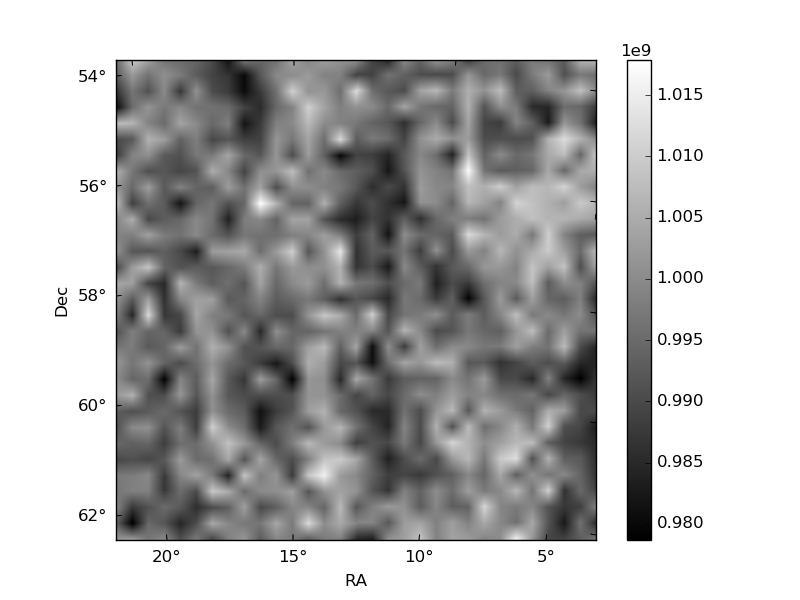
Histogram calculated using DETX and DETY for each event in the final _common_clean file
| Quadrant A |  |
 |
Quadrant B |
|---|---|---|---|
| Quadrant D |  |
 |
Quadrant C |
| Plot type | Count rate plots | Images |
|---|---|---|
| Comparison with Poisson distribution Blue bars denote a histogram of data divided into 1 sec bins. Red curve is a Poisson curve with rate = median count rate of data. |
 |
 |
| Quadrant-wise count rates Data is divided into 100 sec bins |
 |
|
| Module-wise count rates for Quadrant A Data is divided into 100 sec bins |
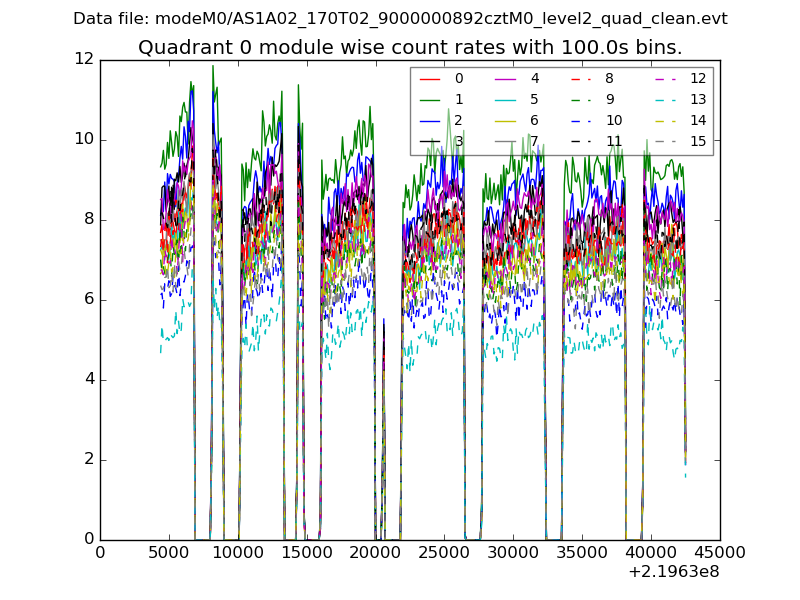 |
 |
| Module-wise count rates for Quadrant B Data is divided into 100 sec bins |
 |
 |
| Module-wise count rates for Quadrant C Data is divided into 100 sec bins |
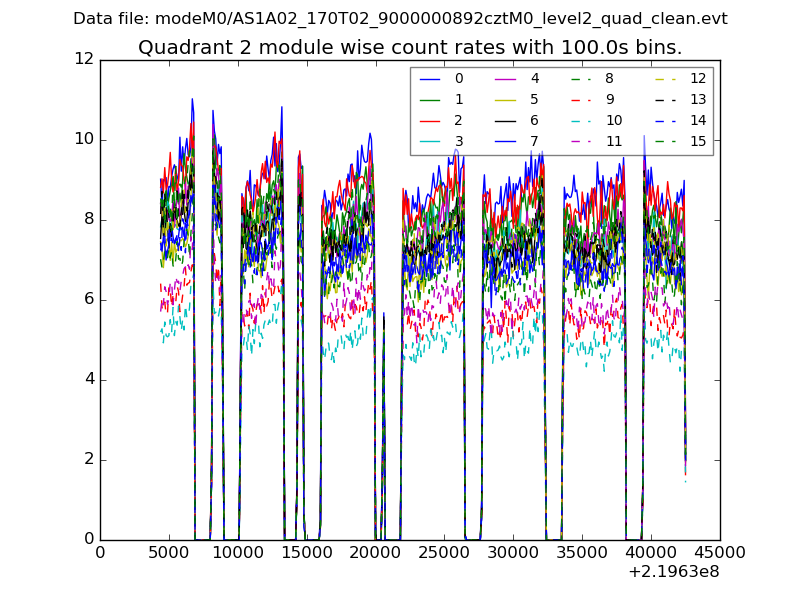 |
 |
| Module-wise count rates for Quadrant D Data is divided into 100 sec bins |
 |
 |
| Parameter | Plot |
|---|---|
| CZT HV Monitor |  |
| D_VDD |  |
| Temperature 1 | 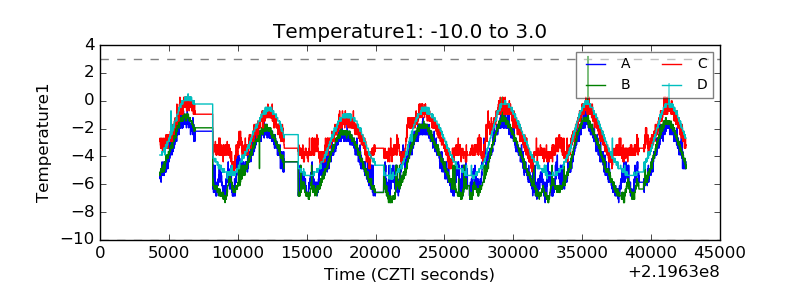 |
| Veto HV Monitor | 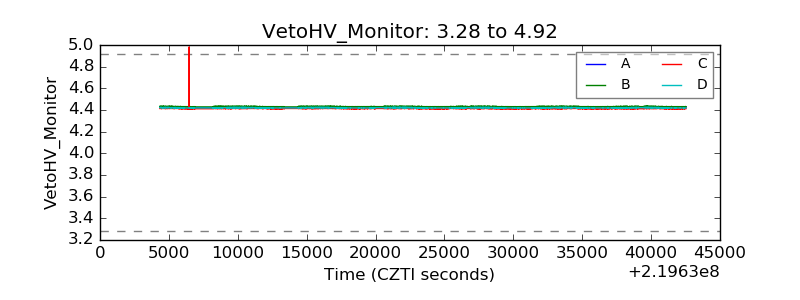 |
| Veto LLD |  |
| Alpha Counter |  |
| _CPM_Rate |  |
| CZT Counter |  |
| +2.5 Volts monitor | 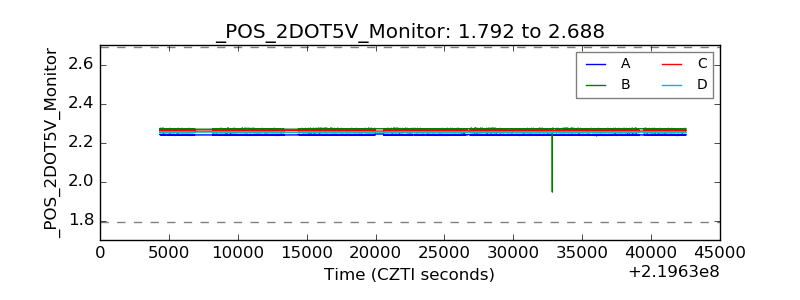 |
| +5 Volts monitor |  |
| _ROLL_ROT |  |
| _Roll_DEC |  |
| _Roll_RA |  |
| Veto Counter |  |