| Param | Original file | Final file |
|---|---|---|
| Filename | modeM0/AS1C02_002T01_9000000888cztM0_level2.evt | modeM0/AS1C02_002T01_9000000888cztM0_level2_quad_clean.evt |
| Size (bytes) | 1,095,528,960 | 176,175,360 |
| Size | 1.0 GB | 168.0 MB |
| Events in quadrant A | 7,298,665 | 1,080,768 |
| Events in quadrant B | 7,647,947 | 1,086,096 |
| Events in quadrant C | 7,068,832 | 1,075,329 |
| Events in quadrant D | 10,112,733 | 1,023,296 |
| Mode SS | |||
|---|---|---|---|
| Quadrant | BADHDUFLAG | Total packets | Discarded packets |
| A | 0 | 314 | 0 |
| B | 0 | 314 | 0 |
| C | 0 | 314 | 0 |
| D | 0 | 314 | 0 |
| Mode M0 | |||
|---|---|---|---|
| Quadrant | BADHDUFLAG | Total packets | Discarded packets |
| A | 0 | 32229 | 0 |
| B | 0 | 33181 | 0 |
| C | 0 | 32124 | 0 |
| D | 0 | 40583 | 0 |
| Mode M9 | |||
|---|---|---|---|
| Quadrant | BADHDUFLAG | Total packets | Discarded packets |
| A | 0 | 7 | 0 |
| B | 0 | 7 | 0 |
| C | 0 | 7 | 0 |
| D | 0 | 7 | 0 |
| Quadrant | Total seconds | Saturated seconds | Saturation percentage |
|---|---|---|---|
| A | 15510 | 539 | 3.475177% |
| B | 15510 | 592 | 3.816892% |
| C | 15510 | 335 | 2.159897% |
| D | 15510 | 1038 | 6.692456% |
Noise dominated data is calculated using 1-second bins in cleaned event files. If a bin has >2000 counts, and if more than 50% of those come from <1% of pixels, then it is considered to be noise-dominated and hence unusable.
| Quadrant | # 1 sec bins | Bins with >0 counts | Bins with >2000 counts | High rate bins dominated by noise | Noise dominated (total time) | Noise dominated (detector-on time) | Marked lightcurve |
|---|---|---|---|---|---|---|---|
| A | 16220 | 15514 | 0 | 0 | 0.00% | 0.00% |  |
| B | 16220 | 15514 | 36 | 36 | 0.22% | 0.23% |  |
| C | 16220 | 15514 | 0 | 0 | 0.00% | 0.00% |  |
| D | 16220 | 15514 | 550 | 550 | 3.39% | 3.55% |  |
Top three noisy pixels from each quadrant. If the there are fewer than three noisy pixels in the level2.evt file, extra rows are filled as -1
| Pixel properties | Quadrant properties | ||||||
|---|---|---|---|---|---|---|---|
| Quadrant | DetID | PixID | Counts | Sigma | Mean | Median | Sigma |
| A | 8 | 15 | 103933 | 270.03 | 1839 | 1790 | 378.3 |
| A | 14 | 111 | 74845 | 193.13 | 1839 | 1790 | 378.3 |
| A | 3 | 1 | 22331 | 54.3 | 1839 | 1790 | 378.3 |
| B | 0 | 219 | 199241 | 549.44 | 1849 | 1798 | 359.4 |
| B | 4 | 81 | 105828 | 289.49 | 1849 | 1798 | 359.4 |
| B | 3 | 220 | 102832 | 281.16 | 1849 | 1798 | 359.4 |
| C | 8 | 128 | 18763 | 40.37 | 1799 | 1803 | 420.1 |
| C | 1 | 16 | 16322 | 34.56 | 1799 | 1803 | 420.1 |
| C | 13 | 61 | 13988 | 29.0 | 1799 | 1803 | 420.1 |
| D | 2 | 63 | 1255939 | 2876.75 | 1773 | 1716 | 436.0 |
| D | 2 | 33 | 1071808 | 2454.42 | 1773 | 1716 | 436.0 |
| D | 2 | 152 | 341427 | 779.18 | 1773 | 1716 | 436.0 |
Histogram calculated using DETX and DETY for each event in the final _common_clean file
| Quadrant A |  |
 |
Quadrant B |
|---|---|---|---|
| Quadrant D |  |
 |
Quadrant C |
| Plot type | Count rate plots | Images |
|---|---|---|
| Comparison with Poisson distribution Blue bars denote a histogram of data divided into 1 sec bins. Red curve is a Poisson curve with rate = median count rate of data. |
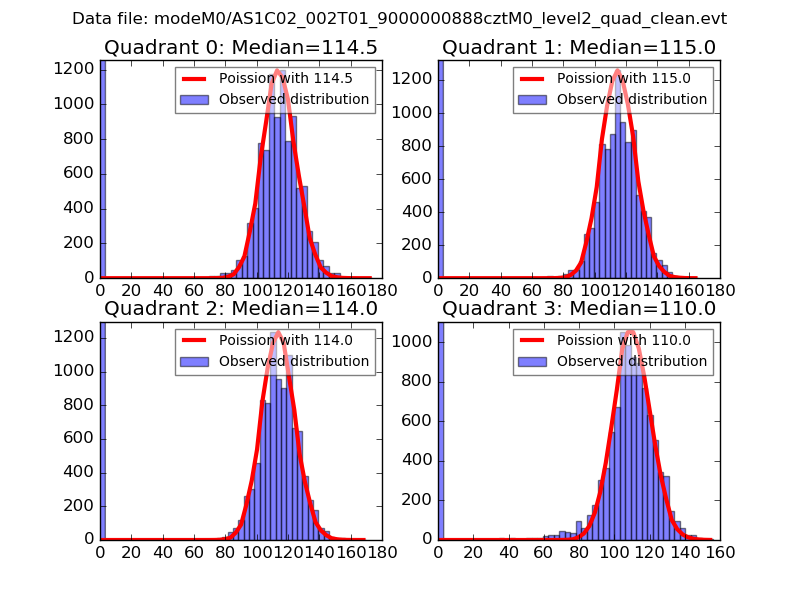 |
 |
| Quadrant-wise count rates Data is divided into 100 sec bins |
 |
|
| Module-wise count rates for Quadrant A Data is divided into 100 sec bins |
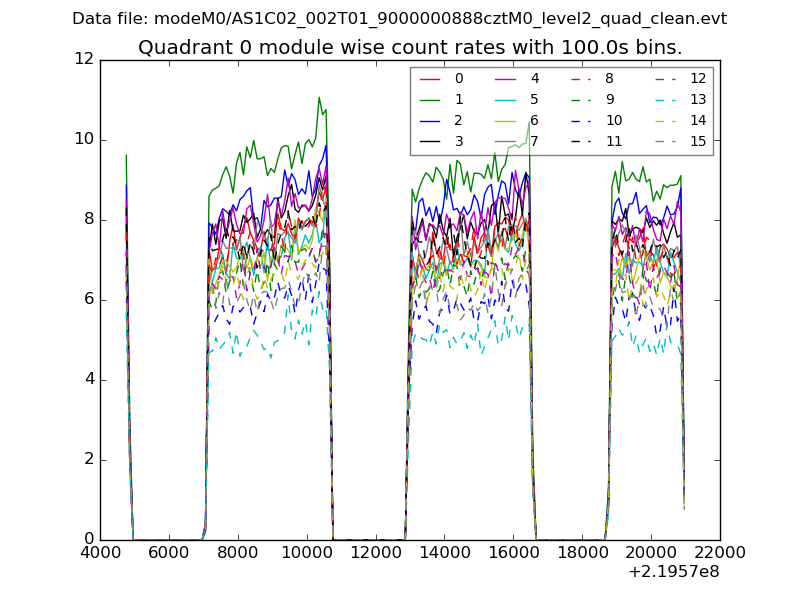 |
 |
| Module-wise count rates for Quadrant B Data is divided into 100 sec bins |
 |
 |
| Module-wise count rates for Quadrant C Data is divided into 100 sec bins |
 |
 |
| Module-wise count rates for Quadrant D Data is divided into 100 sec bins |
 |
 |
| Parameter | Plot |
|---|---|
| CZT HV Monitor |  |
| D_VDD |  |
| Temperature 1 |  |
| Veto HV Monitor |  |
| Veto LLD |  |
| Alpha Counter |  |
| _CPM_Rate |  |
| CZT Counter |  |
| +2.5 Volts monitor |  |
| +5 Volts monitor |  |
| _ROLL_ROT |  |
| _Roll_DEC |  |
| _Roll_RA | 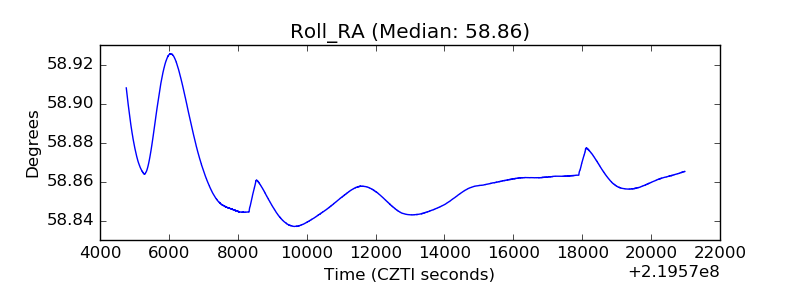 |
| Veto Counter |  |