| Param | Original file | Final file |
|---|---|---|
| Filename | modeM0/AS1G06_169T01_9000000886cztM0_level2.evt | modeM0/AS1G06_169T01_9000000886cztM0_level2_quad_clean.evt |
| Size (bytes) | 2,023,303,680 | 313,940,160 |
| Size | 1.9 GB | 299.4 MB |
| Events in quadrant A | 13,452,586 | 1,926,416 |
| Events in quadrant B | 14,909,508 | 1,946,089 |
| Events in quadrant C | 12,909,185 | 1,907,901 |
| Events in quadrant D | 18,100,472 | 1,788,611 |
| Mode M0 | |||
|---|---|---|---|
| Quadrant | BADHDUFLAG | Total packets | Discarded packets |
| A | 0 | 58742 | 0 |
| B | 0 | 62714 | 0 |
| C | 0 | 58164 | 0 |
| D | 0 | 72945 | 0 |
| Mode M9 | |||
|---|---|---|---|
| Quadrant | BADHDUFLAG | Total packets | Discarded packets |
| A | 0 | 47 | 0 |
| B | 0 | 47 | 0 |
| C | 0 | 47 | 0 |
| D | 0 | 47 | 0 |
| Mode SS | |||
|---|---|---|---|
| Quadrant | BADHDUFLAG | Total packets | Discarded packets |
| A | 0 | 576 | 0 |
| B | 0 | 576 | 0 |
| C | 0 | 576 | 0 |
| D | 0 | 576 | 0 |
| Quadrant | Total seconds | Saturated seconds | Saturation percentage |
|---|---|---|---|
| A | 28189 | 509 | 1.805669% |
| B | 28189 | 597 | 2.117847% |
| C | 28189 | 310 | 1.099720% |
| D | 28189 | 1373 | 4.870694% |
Noise dominated data is calculated using 1-second bins in cleaned event files. If a bin has >2000 counts, and if more than 50% of those come from <1% of pixels, then it is considered to be noise-dominated and hence unusable.
| Quadrant | # 1 sec bins | Bins with >0 counts | Bins with >2000 counts | High rate bins dominated by noise | Noise dominated (total time) | Noise dominated (detector-on time) | Marked lightcurve |
|---|---|---|---|---|---|---|---|
| A | 32994 | 28196 | 40 | 40 | 0.12% | 0.14% | 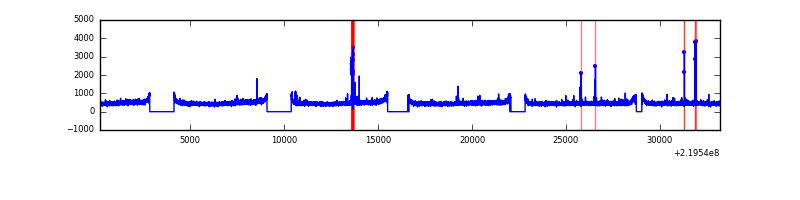 |
| B | 32994 | 28196 | 90 | 90 | 0.27% | 0.32% |  |
| C | 32994 | 28196 | 5 | 5 | 0.02% | 0.02% |  |
| D | 32994 | 28196 | 939 | 939 | 2.85% | 3.33% |  |
Top three noisy pixels from each quadrant. If the there are fewer than three noisy pixels in the level2.evt file, extra rows are filled as -1
| Pixel properties | Quadrant properties | ||||||
|---|---|---|---|---|---|---|---|
| Quadrant | DetID | PixID | Counts | Sigma | Mean | Median | Sigma |
| A | 14 | 111 | 176038 | 254.88 | 3375 | 3302 | 677.7 |
| A | 8 | 15 | 147918 | 213.39 | 3375 | 3302 | 677.7 |
| A | 3 | 1 | 44294 | 60.49 | 3375 | 3302 | 677.7 |
| B | 4 | 81 | 400515 | 619.79 | 3385 | 3301 | 640.9 |
| B | 0 | 219 | 356547 | 551.18 | 3385 | 3301 | 640.9 |
| B | 4 | 80 | 310934 | 480.01 | 3385 | 3301 | 640.9 |
| C | 9 | 54 | 66860 | 84.61 | 3262 | 3268 | 751.6 |
| C | 9 | 16 | 61088 | 76.93 | 3262 | 3268 | 751.6 |
| C | 1 | 16 | 37982 | 46.19 | 3262 | 3268 | 751.6 |
| D | 2 | 33 | 3612780 | 4588.17 | 3240 | 3136 | 786.7 |
| D | 2 | 152 | 525064 | 663.42 | 3240 | 3136 | 786.7 |
| D | 2 | 136 | 524234 | 662.36 | 3240 | 3136 | 786.7 |
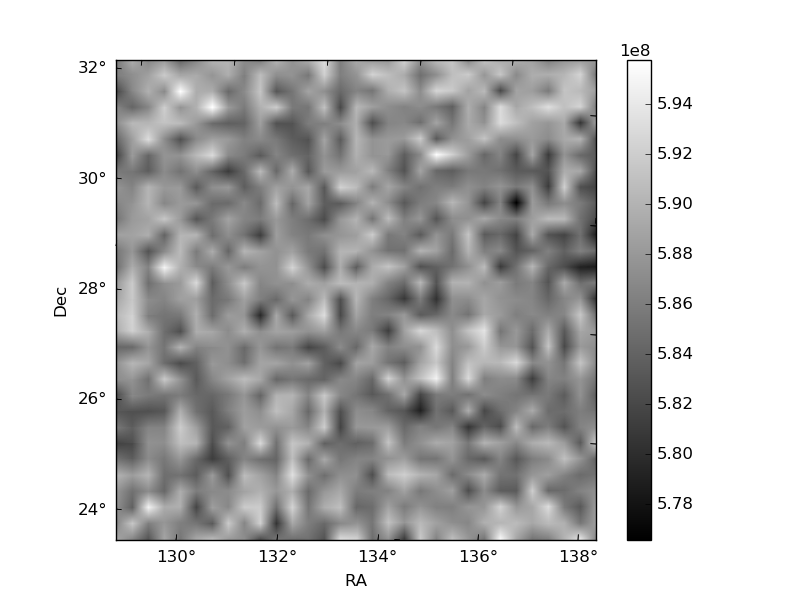
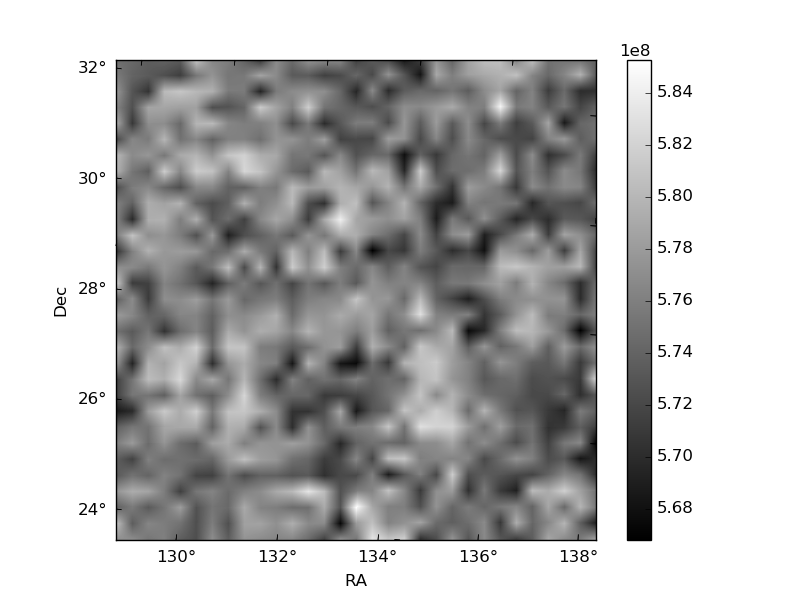
Histogram calculated using DETX and DETY for each event in the final _common_clean file
| Quadrant A |  |
 |
Quadrant B |
|---|---|---|---|
| Quadrant D |  |
 |
Quadrant C |
| Plot type | Count rate plots | Images |
|---|---|---|
| Comparison with Poisson distribution Blue bars denote a histogram of data divided into 1 sec bins. Red curve is a Poisson curve with rate = median count rate of data. |
 |
 |
| Quadrant-wise count rates Data is divided into 100 sec bins |
 |
|
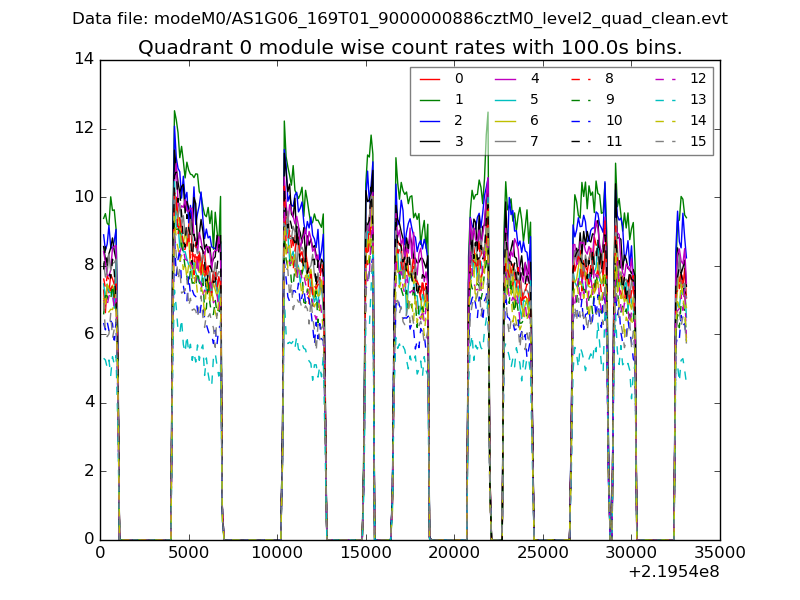
| Module-wise count rates for Quadrant A Data is divided into 100 sec bins |
 |
 |
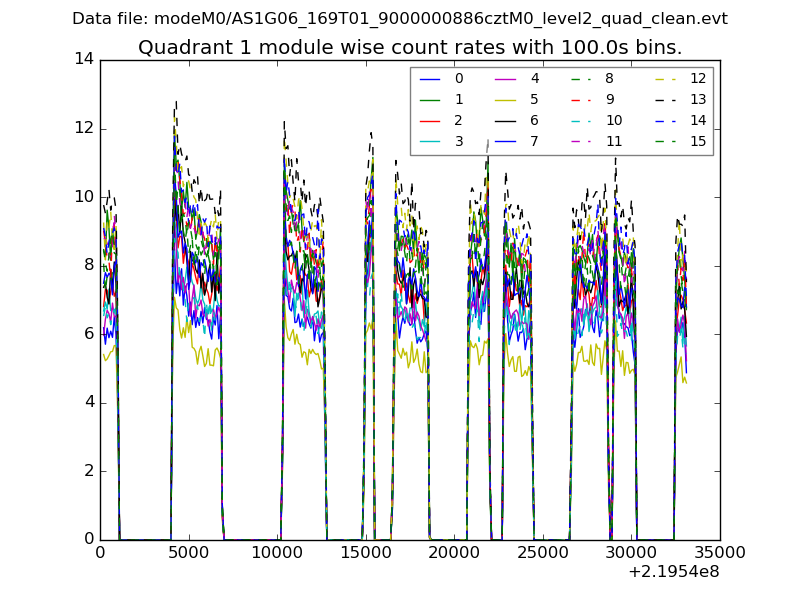
| Module-wise count rates for Quadrant B Data is divided into 100 sec bins |
 |
 |
| Module-wise count rates for Quadrant C Data is divided into 100 sec bins |
 |
 |
| Module-wise count rates for Quadrant D Data is divided into 100 sec bins |
 |
 |
| Parameter | Plot |
|---|---|
| CZT HV Monitor | 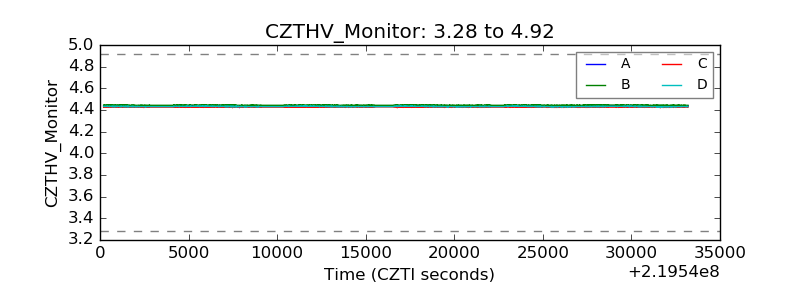 |
| D_VDD |  |
| Temperature 1 |  |
| Veto HV Monitor |  |
| Veto LLD | 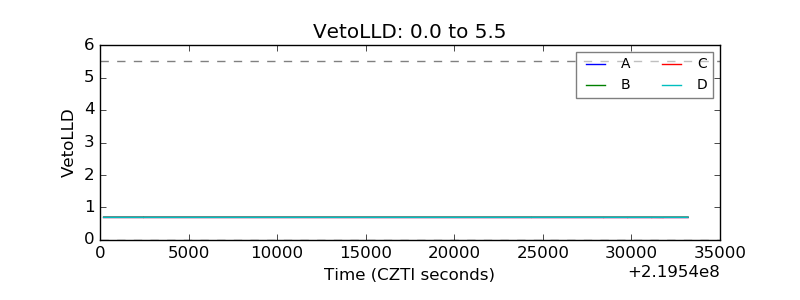 |
| Alpha Counter |  |
| _CPM_Rate |  |
| CZT Counter | 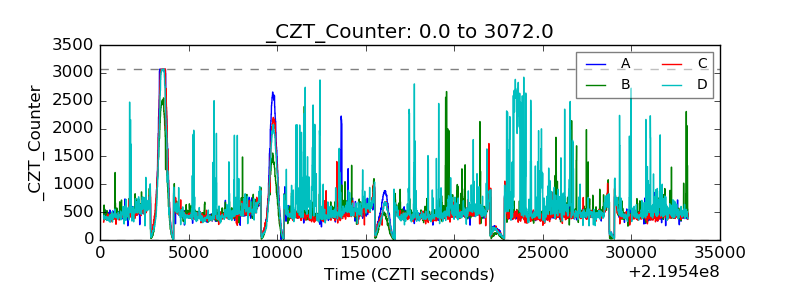 |
| +2.5 Volts monitor |  |
| +5 Volts monitor |  |
| _ROLL_ROT |  |
| _Roll_DEC |  |
| _Roll_RA |  |
| Veto Counter | 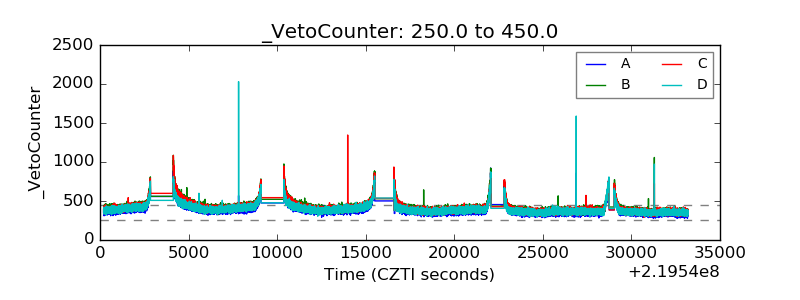 |