| Param | Original file | Final file |
|---|---|---|
| Filename | modeM0/AS1C02_008T01_9000000884cztM0_level2.evt | modeM0/AS1C02_008T01_9000000884cztM0_level2_quad_clean.evt |
| Size (bytes) | 4,459,207,680 | 753,586,560 |
| Size | 4.2 GB | 718.7 MB |
| Events in quadrant A | 30,908,184 | 4,647,714 |
| Events in quadrant B | 32,769,728 | 4,694,591 |
| Events in quadrant C | 29,115,429 | 4,616,698 |
| Events in quadrant D | 37,887,021 | 4,428,106 |
| Mode M0 | |||
|---|---|---|---|
| Quadrant | BADHDUFLAG | Total packets | Discarded packets |
| A | 0 | 135886 | 0 |
| B | 0 | 139983 | 0 |
| C | 0 | 132550 | 0 |
| D | 0 | 158131 | 0 |
| Mode SS | |||
|---|---|---|---|
| Quadrant | BADHDUFLAG | Total packets | Discarded packets |
| A | 0 | 1318 | 0 |
| B | 0 | 1318 | 0 |
| C | 0 | 1318 | 0 |
| D | 0 | 1318 | 0 |
| Mode M9 | |||
|---|---|---|---|
| Quadrant | BADHDUFLAG | Total packets | Discarded packets |
| A | 0 | 92 | 0 |
| B | 0 | 92 | 0 |
| C | 0 | 92 | 0 |
| D | 0 | 92 | 0 |
| Quadrant | Total seconds | Saturated seconds | Saturation percentage |
|---|---|---|---|
| A | 64712 | 1191 | 1.840462% |
| B | 64712 | 1246 | 1.925454% |
| C | 64712 | 599 | 0.925640% |
| D | 64712 | 1801 | 2.783101% |
Noise dominated data is calculated using 1-second bins in cleaned event files. If a bin has >2000 counts, and if more than 50% of those come from <1% of pixels, then it is considered to be noise-dominated and hence unusable.
| Quadrant | # 1 sec bins | Bins with >0 counts | Bins with >2000 counts | High rate bins dominated by noise | Noise dominated (total time) | Noise dominated (detector-on time) | Marked lightcurve |
|---|---|---|---|---|---|---|---|
| A | 73918 | 64726 | 221 | 221 | 0.30% | 0.34% |  |
| B | 73918 | 64726 | 190 | 190 | 0.26% | 0.29% |  |
| C | 73918 | 64726 | 1 | 1 | 0.00% | 0.00% |  |
| D | 73918 | 64726 | 884 | 884 | 1.20% | 1.37% |  |
Top three noisy pixels from each quadrant. If the there are fewer than three noisy pixels in the level2.evt file, extra rows are filled as -1
| Pixel properties | Quadrant properties | ||||||
|---|---|---|---|---|---|---|---|
| Quadrant | DetID | PixID | Counts | Sigma | Mean | Median | Sigma |
| A | 15 | 234 | 972954 | 629.59 | 7604 | 7439 | 1533.6 |
| A | 8 | 15 | 460312 | 295.31 | 7604 | 7439 | 1533.6 |
| A | 14 | 111 | 115155 | 70.24 | 7604 | 7439 | 1533.6 |
| B | 5 | 143 | 785535 | 530.34 | 7663 | 7481 | 1467.1 |
| B | 4 | 172 | 536072 | 360.3 | 7663 | 7481 | 1467.1 |
| B | 0 | 219 | 497068 | 333.71 | 7663 | 7481 | 1467.1 |
| C | 13 | 61 | 57758 | 29.09 | 7431 | 7463 | 1728.8 |
| C | 9 | 54 | 42892 | 20.49 | 7431 | 7463 | 1728.8 |
| C | 1 | 16 | 39937 | 18.78 | 7431 | 7463 | 1728.8 |
| D | 2 | 33 | 3385409 | 1875.95 | 7376 | 7164 | 1800.8 |
| D | 12 | 221 | 1851114 | 1023.95 | 7376 | 7164 | 1800.8 |
| D | 14 | 34 | 1029214 | 567.55 | 7376 | 7164 | 1800.8 |
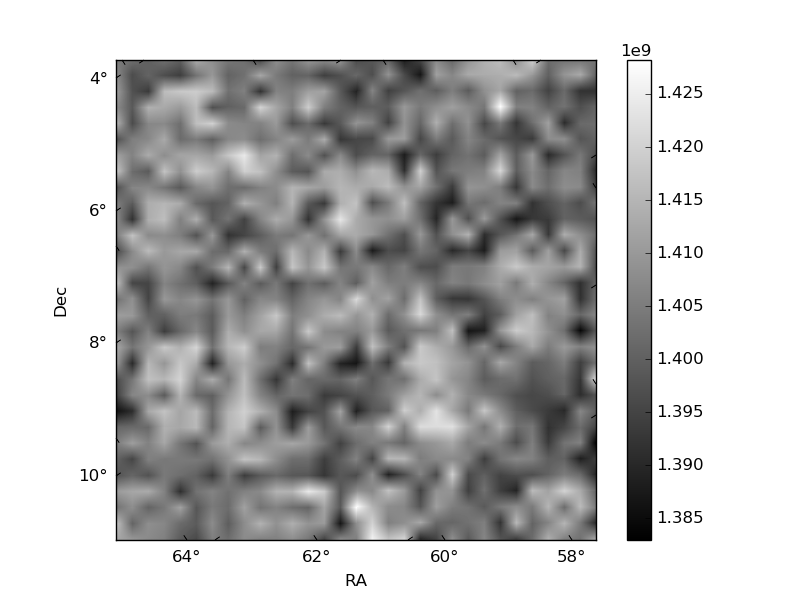
Histogram calculated using DETX and DETY for each event in the final _common_clean file
| Quadrant A |  |
 |
Quadrant B |
|---|---|---|---|
| Quadrant D |  |
 |
Quadrant C |
| Plot type | Count rate plots | Images |
|---|---|---|
| Comparison with Poisson distribution Blue bars denote a histogram of data divided into 1 sec bins. Red curve is a Poisson curve with rate = median count rate of data. |
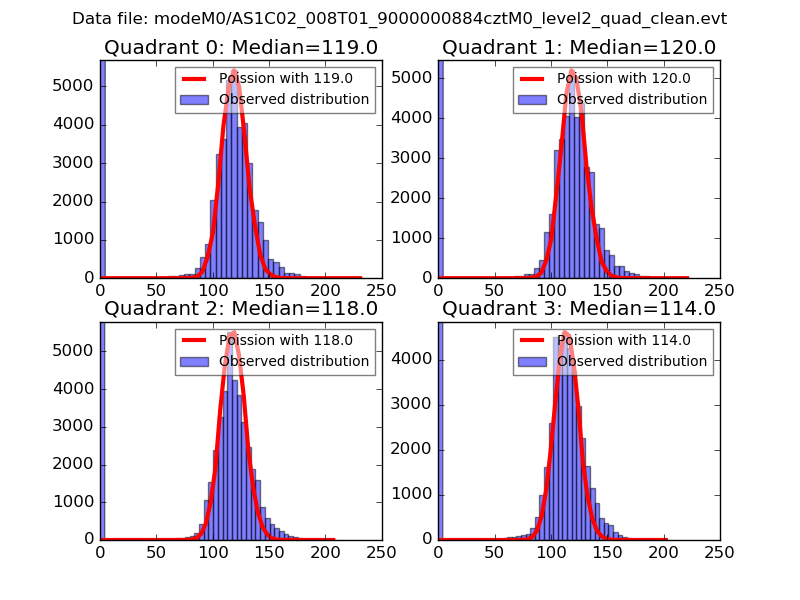 |
 |
| Quadrant-wise count rates Data is divided into 100 sec bins |
 |
|
| Module-wise count rates for Quadrant A Data is divided into 100 sec bins |
 |
 |
| Module-wise count rates for Quadrant B Data is divided into 100 sec bins |
 |
 |
| Module-wise count rates for Quadrant C Data is divided into 100 sec bins |
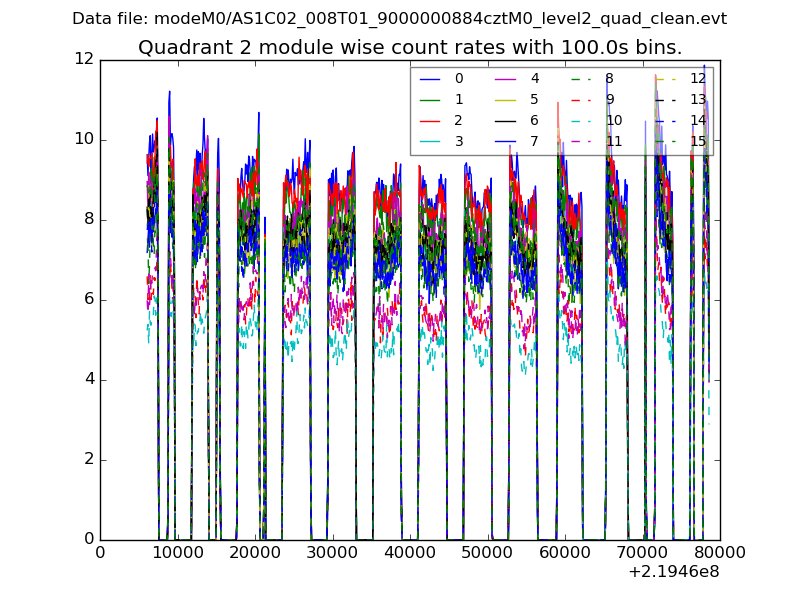 |
 |
| Module-wise count rates for Quadrant D Data is divided into 100 sec bins |
 |
 |
| Parameter | Plot |
|---|---|
| CZT HV Monitor |  |
| D_VDD |  |
| Temperature 1 | 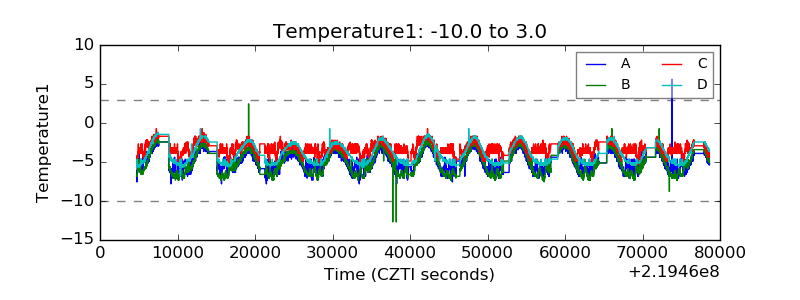 |
| Veto HV Monitor | 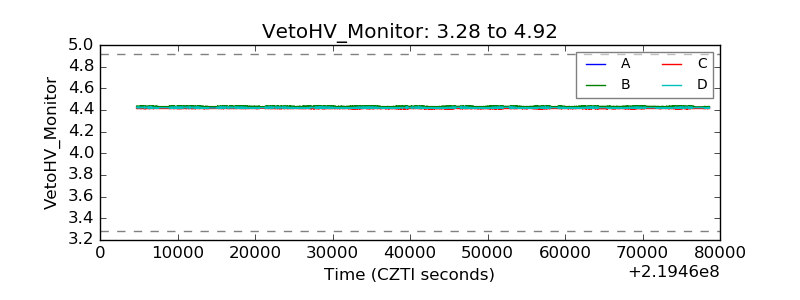 |
| Veto LLD |  |
| Alpha Counter |  |
| _CPM_Rate |  |
| CZT Counter |  |
| +2.5 Volts monitor |  |
| +5 Volts monitor | 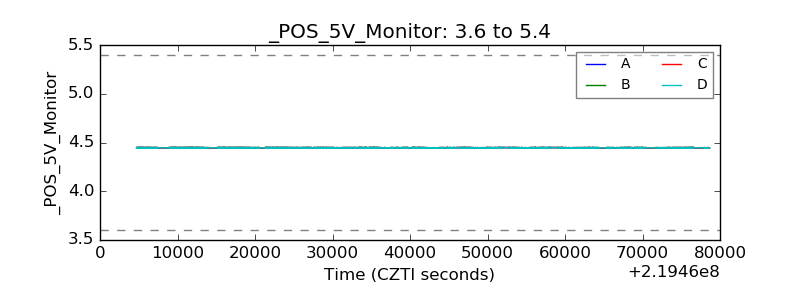 |
| _ROLL_ROT |  |
| _Roll_DEC |  |
| _Roll_RA | 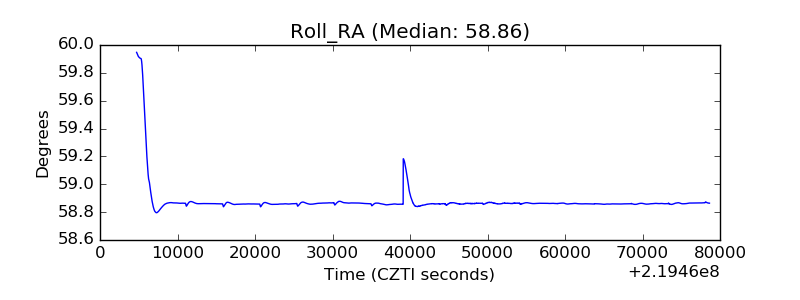 |
| Veto Counter |  |