| Param | Original file | Final file |
|---|---|---|
| Filename | modeM0/AS1G05_246T04_9000000882cztM0_level2.evt | modeM0/AS1G05_246T04_9000000882cztM0_level2_quad_clean.evt |
| Size (bytes) | 7,199,406,720 | 1,352,036,160 |
| Size | 6.7 GB | 1.3 GB |
| Events in quadrant A | 47,995,167 | 8,006,861 |
| Events in quadrant B | 51,261,646 | 8,129,053 |
| Events in quadrant C | 45,818,693 | 8,063,468 |
| Events in quadrant D | 66,016,026 | 9,698,736 |
| Mode M9 | |||
|---|---|---|---|
| Quadrant | BADHDUFLAG | Total packets | Discarded packets |
| A | 0 | 140 | 0 |
| B | 0 | 140 | 0 |
| C | 0 | 140 | 0 |
| D | 0 | 139 | 0 |
| Mode M0 | |||
|---|---|---|---|
| Quadrant | BADHDUFLAG | Total packets | Discarded packets |
| A | 0 | 212907 | 0 |
| B | 0 | 221906 | 0 |
| C | 0 | 210905 | 0 |
| D | 0 | 268540 | 0 |
| Mode SS | |||
|---|---|---|---|
| Quadrant | BADHDUFLAG | Total packets | Discarded packets |
| A | 0 | 2100 | 0 |
| B | 0 | 2102 | 0 |
| C | 0 | 2098 | 0 |
| D | 0 | 2092 | 0 |
| Quadrant | Total seconds | Saturated seconds | Saturation percentage |
|---|---|---|---|
| A | 102920 | 1357 | 1.318500% |
| B | 102873 | 1992 | 1.936368% |
| C | 102917 | 952 | 0.925017% |
| D | 102921 | 3286 | 3.192740% |
Noise dominated data is calculated using 1-second bins in cleaned event files. If a bin has >2000 counts, and if more than 50% of those come from <1% of pixels, then it is considered to be noise-dominated and hence unusable.
| Quadrant | # 1 sec bins | Bins with >0 counts | Bins with >2000 counts | High rate bins dominated by noise | Noise dominated (total time) | Noise dominated (detector-on time) | Marked lightcurve |
|---|---|---|---|---|---|---|---|
| A | 118300 | 103727 | 58 | 58 | 0.05% | 0.06% |  |
| B | 118300 | 103673 | 389 | 389 | 0.33% | 0.38% |  |
| C | 118300 | 103735 | 15 | 15 | 0.01% | 0.01% |  |
| D | 118300 | 103730 | 1652 | 1652 | 1.40% | 1.59% | 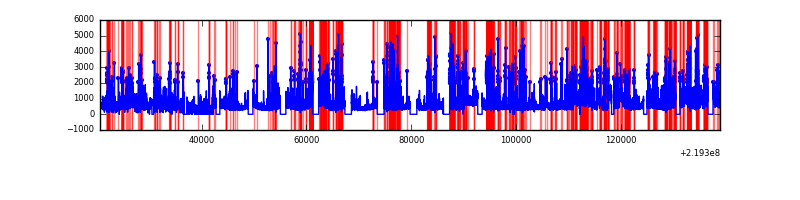 |
Top three noisy pixels from each quadrant. If the there are fewer than three noisy pixels in the level2.evt file, extra rows are filled as -1
| Pixel properties | Quadrant properties | ||||||
|---|---|---|---|---|---|---|---|
| Quadrant | DetID | PixID | Counts | Sigma | Mean | Median | Sigma |
| A | 8 | 15 | 1259559 | 520.15 | 11931 | 11687 | 2399.0 |
| A | 13 | 251 | 336484 | 135.39 | 11931 | 11687 | 2399.0 |
| A | 9 | 1 | 228723 | 90.47 | 11931 | 11687 | 2399.0 |
| B | 0 | 219 | 889529 | 387.63 | 12002 | 11715 | 2264.5 |
| B | 4 | 48 | 850887 | 370.57 | 12002 | 11715 | 2264.5 |
| B | 4 | 81 | 649489 | 281.64 | 12002 | 11715 | 2264.5 |
| C | 9 | 237 | 251908 | 90.06 | 11619 | 11660 | 2667.7 |
| C | 13 | 61 | 91863 | 30.06 | 11619 | 11660 | 2667.7 |
| C | 9 | 54 | 70584 | 22.09 | 11619 | 11660 | 2667.7 |
| D | 12 | 221 | 8721687 | 3110.76 | 11503 | 11158 | 2800.1 |
| D | 2 | 33 | 4636699 | 1651.9 | 11503 | 11158 | 2800.1 |
| D | 14 | 34 | 2407507 | 855.8 | 11503 | 11158 | 2800.1 |
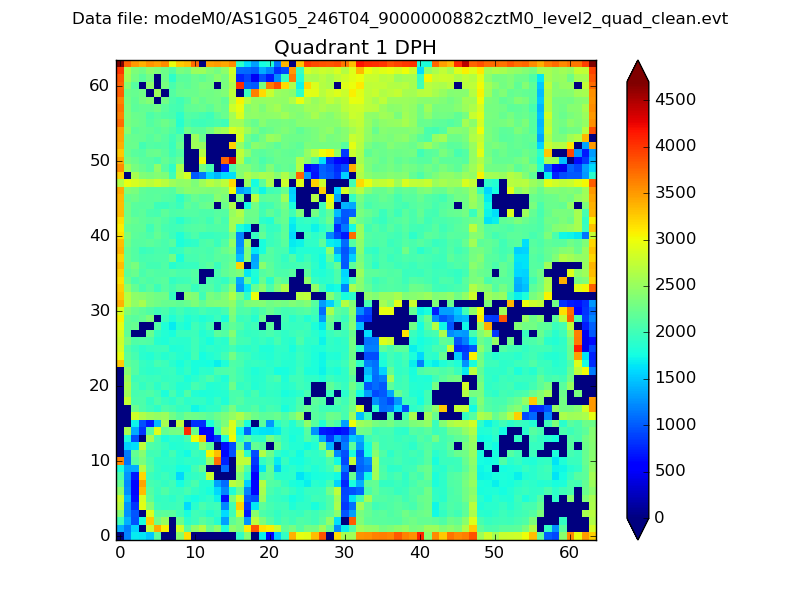
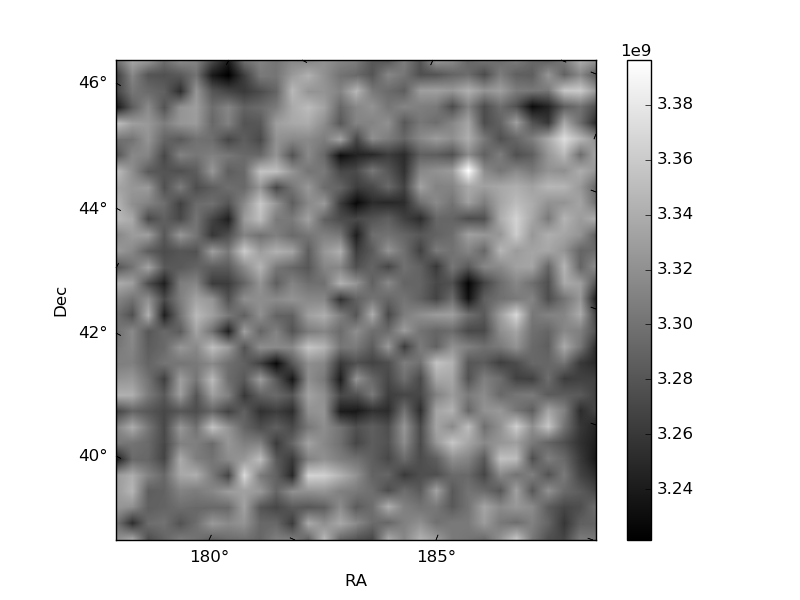
Histogram calculated using DETX and DETY for each event in the final _common_clean file
| Quadrant A |  |
 |
Quadrant B |
|---|---|---|---|
| Quadrant D |  |
 |
Quadrant C |
| Plot type | Count rate plots | Images |
|---|---|---|
| Comparison with Poisson distribution Blue bars denote a histogram of data divided into 1 sec bins. Red curve is a Poisson curve with rate = median count rate of data. |
 |
 |
| Quadrant-wise count rates Data is divided into 100 sec bins |
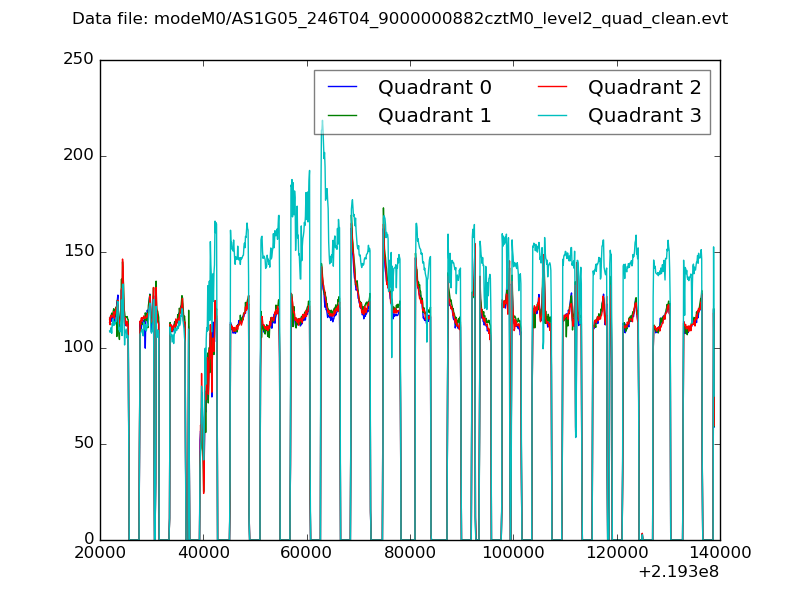 |
|
| Module-wise count rates for Quadrant A Data is divided into 100 sec bins |
 |
 |
| Module-wise count rates for Quadrant B Data is divided into 100 sec bins |
 |
 |
| Module-wise count rates for Quadrant C Data is divided into 100 sec bins |
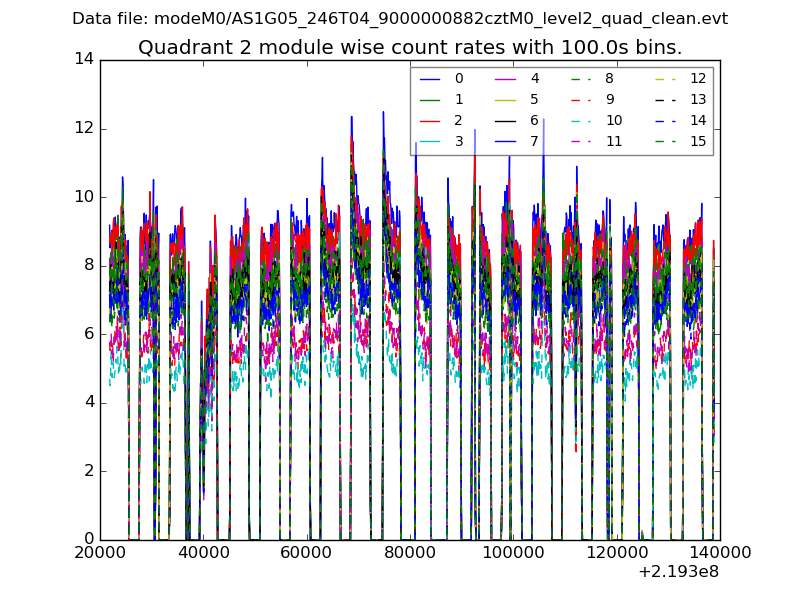 |
 |
| Module-wise count rates for Quadrant D Data is divided into 100 sec bins |
 |
 |
| Parameter | Plot |
|---|---|
| CZT HV Monitor |  |
| D_VDD |  |
| Temperature 1 | 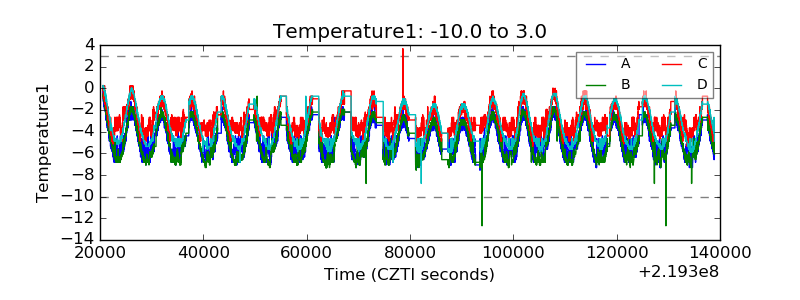 |
| Veto HV Monitor | 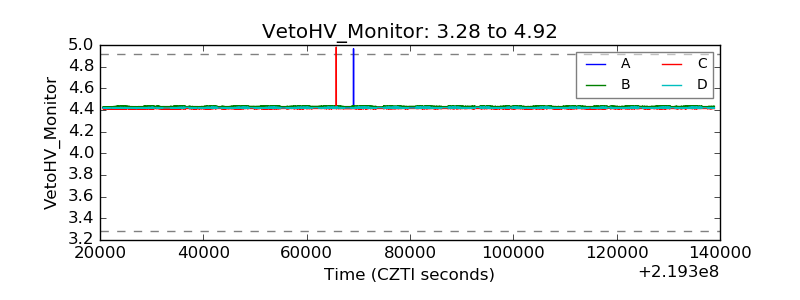 |
| Veto LLD |  |
| Alpha Counter |  |
| _CPM_Rate | 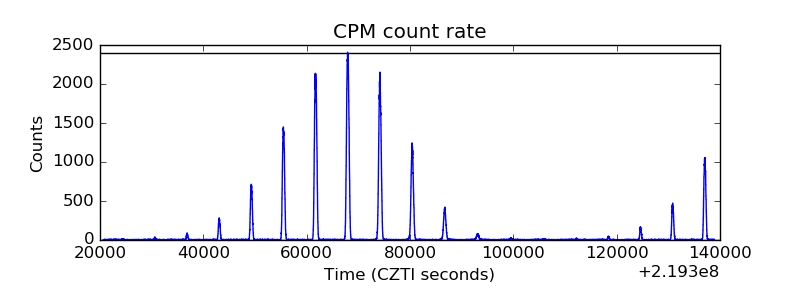 |
| CZT Counter |  |
| +2.5 Volts monitor |  |
| +5 Volts monitor |  |
| _ROLL_ROT |  |
| _Roll_DEC | 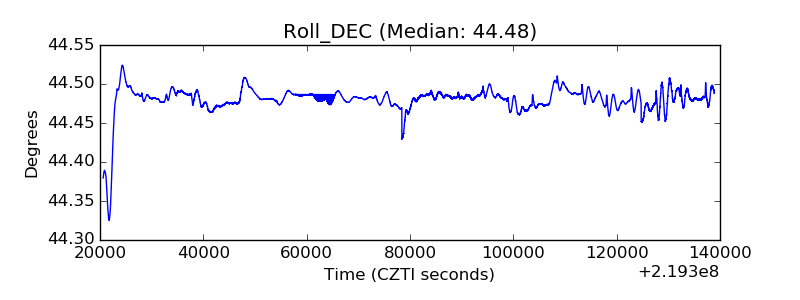 |
| _Roll_RA |  |
| Veto Counter | 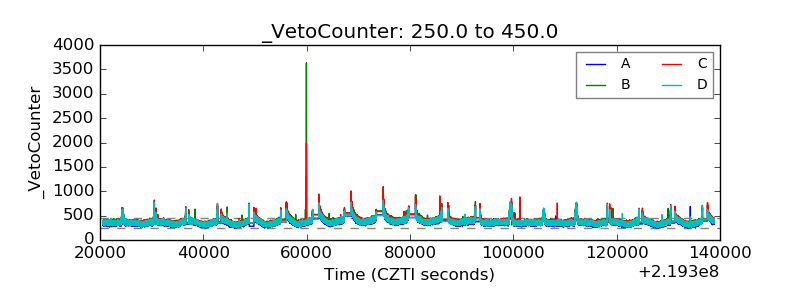 |