| Param | Original file | Final file |
|---|---|---|
| Filename | modeM0/AS1G06_134T06_9000000878cztM0_level2.evt | modeM0/AS1G06_134T06_9000000878cztM0_level2_quad_clean.evt |
| Size (bytes) | 738,797,760 | 122,728,320 |
| Size | 704.6 MB | 117.0 MB |
| Events in quadrant A | 5,196,928 | 761,049 |
| Events in quadrant B | 5,055,777 | 762,116 |
| Events in quadrant C | 4,529,314 | 758,656 |
| Events in quadrant D | 6,902,783 | 730,471 |
| Mode SS | |||
|---|---|---|---|
| Quadrant | BADHDUFLAG | Total packets | Discarded packets |
| A | 0 | 200 | 0 |
| B | 0 | 202 | 0 |
| C | 0 | 200 | 0 |
| D | 0 | 202 | 0 |
| Mode M0 | |||
|---|---|---|---|
| Quadrant | BADHDUFLAG | Total packets | Discarded packets |
| A | 0 | 22293 | 0 |
| B | 0 | 21953 | 0 |
| C | 0 | 20980 | 0 |
| D | 0 | 27634 | 0 |
| Mode M9 | |||
|---|---|---|---|
| Quadrant | BADHDUFLAG | Total packets | Discarded packets |
| A | 0 | 2 | 0 |
| B | 0 | 2 | 0 |
| C | 0 | 2 | 0 |
| D | 0 | 2 | 0 |
| Quadrant | Total seconds | Saturated seconds | Saturation percentage |
|---|---|---|---|
| A | 10173 | 318 | 3.125922% |
| B | 10188 | 346 | 3.396152% |
| C | 10169 | 140 | 1.376733% |
| D | 10179 | 929 | 9.126633% |
Noise dominated data is calculated using 1-second bins in cleaned event files. If a bin has >2000 counts, and if more than 50% of those come from <1% of pixels, then it is considered to be noise-dominated and hence unusable.
| Quadrant | # 1 sec bins | Bins with >0 counts | Bins with >2000 counts | High rate bins dominated by noise | Noise dominated (total time) | Noise dominated (detector-on time) | Marked lightcurve |
|---|---|---|---|---|---|---|---|
| A | 10281 | 10247 | 18 | 18 | 0.18% | 0.18% |  |
| B | 10281 | 10255 | 36 | 36 | 0.35% | 0.35% |  |
| C | 10281 | 10253 | 0 | 0 | 0.00% | 0.00% | 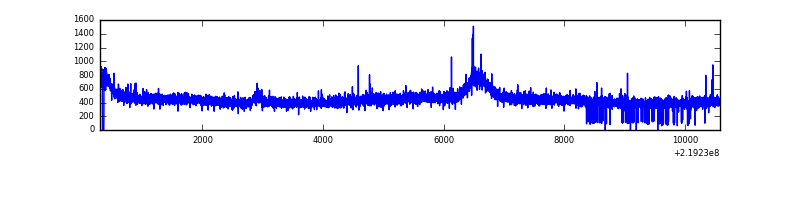 |
| D | 10281 | 10254 | 712 | 712 | 6.93% | 6.94% |  |
Top three noisy pixels from each quadrant. If the there are fewer than three noisy pixels in the level2.evt file, extra rows are filled as -1
| Pixel properties | Quadrant properties | ||||||
|---|---|---|---|---|---|---|---|
| Quadrant | DetID | PixID | Counts | Sigma | Mean | Median | Sigma |
| A | 15 | 236 | 374780 | 1544.4 | 1176 | 1146 | 241.9 |
| A | 8 | 15 | 166712 | 684.36 | 1176 | 1146 | 241.9 |
| A | 14 | 111 | 96249 | 393.1 | 1176 | 1146 | 241.9 |
| B | 0 | 219 | 138910 | 610.66 | 1177 | 1149 | 225.6 |
| B | 15 | 85 | 68630 | 299.13 | 1177 | 1149 | 225.6 |
| B | 0 | 214 | 52786 | 228.89 | 1177 | 1149 | 225.6 |
| C | 8 | 128 | 21546 | 76.8 | 1144 | 1148 | 265.6 |
| C | 9 | 54 | 11612 | 39.39 | 1144 | 1148 | 265.6 |
| C | 8 | 112 | 10602 | 35.59 | 1144 | 1148 | 265.6 |
| D | 13 | 169 | 1901075 | 6854.21 | 1127 | 1091 | 277.2 |
| D | 12 | 233 | 195611 | 701.73 | 1127 | 1091 | 277.2 |
| D | 2 | 152 | 173175 | 620.79 | 1127 | 1091 | 277.2 |
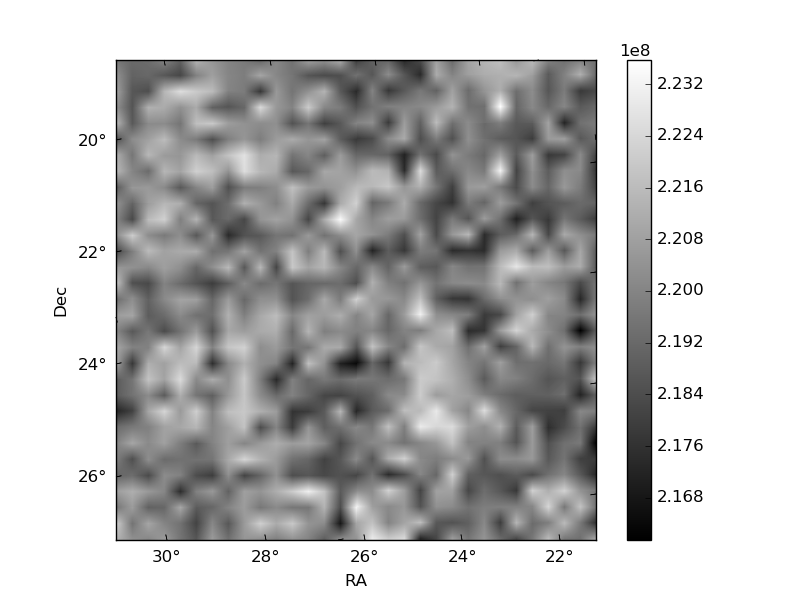
Histogram calculated using DETX and DETY for each event in the final _common_clean file
| Quadrant A |  |
 |
Quadrant B |
|---|---|---|---|
| Quadrant D | 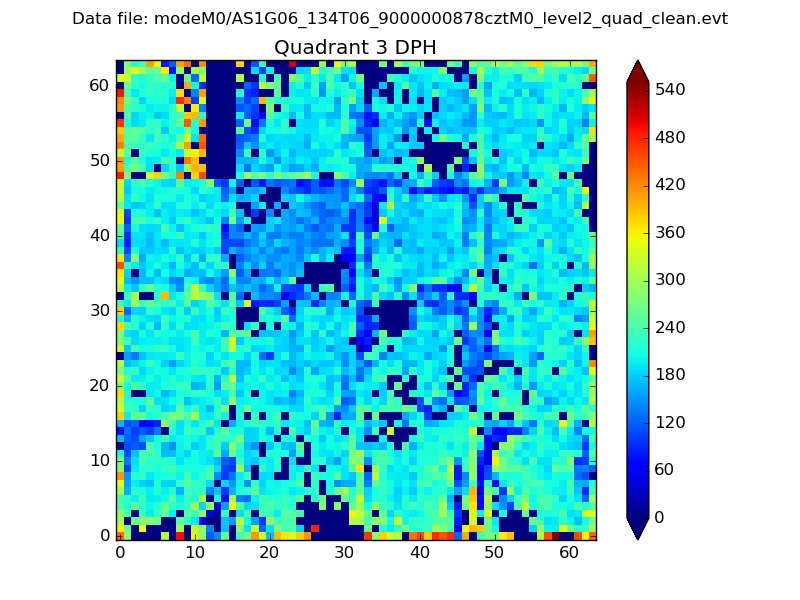 |
 |
Quadrant C |
| Plot type | Count rate plots | Images |
|---|---|---|
| Comparison with Poisson distribution Blue bars denote a histogram of data divided into 1 sec bins. Red curve is a Poisson curve with rate = median count rate of data. |
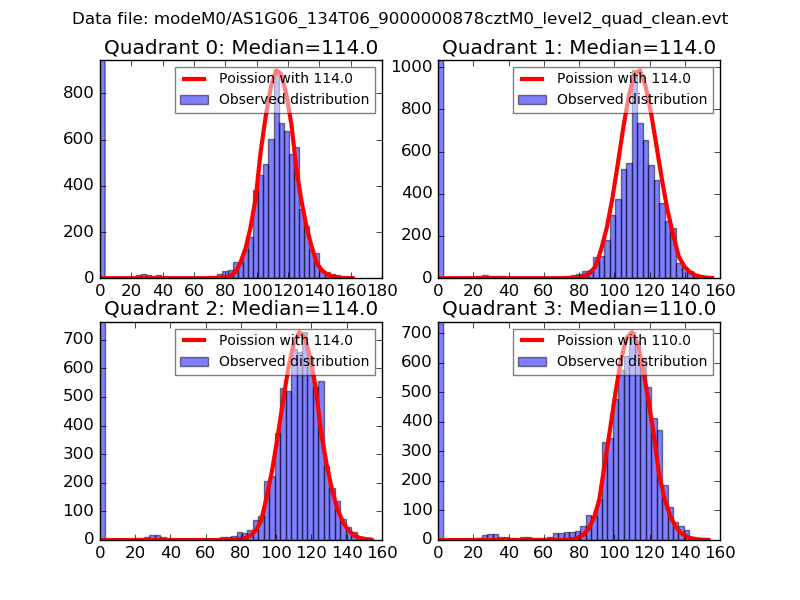 |
 |
| Quadrant-wise count rates Data is divided into 100 sec bins |
 |
|
| Module-wise count rates for Quadrant A Data is divided into 100 sec bins |
 |
 |
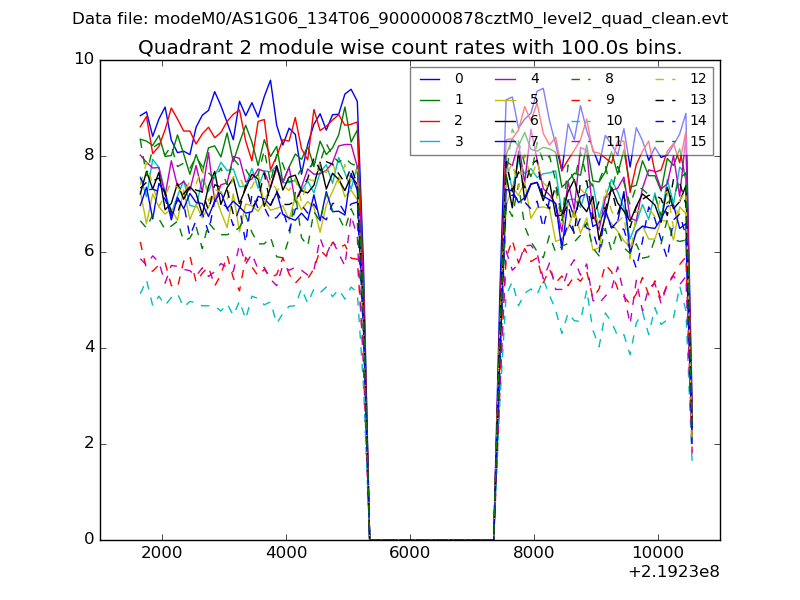
| Module-wise count rates for Quadrant B Data is divided into 100 sec bins |
 |
 |
| Module-wise count rates for Quadrant C Data is divided into 100 sec bins |
 |
 |
| Module-wise count rates for Quadrant D Data is divided into 100 sec bins |
 |
 |
| Parameter | Plot |
|---|---|
| CZT HV Monitor |  |
| D_VDD |  |
| Temperature 1 |  |
| Veto HV Monitor |  |
| Veto LLD |  |
| Alpha Counter | 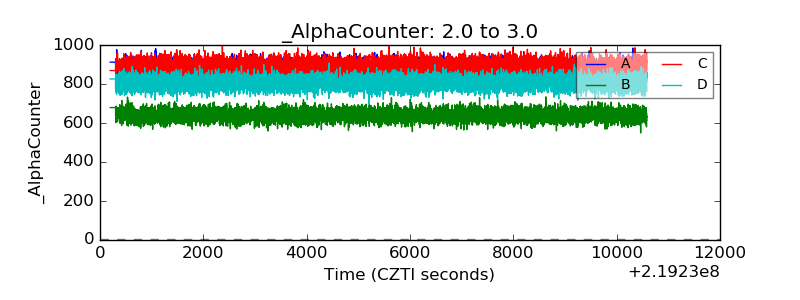 |
| _CPM_Rate |  |
| CZT Counter |  |
| +2.5 Volts monitor |  |
| +5 Volts monitor |  |
| _ROLL_ROT |  |
| _Roll_DEC |  |
| _Roll_RA |  |
| Veto Counter |  |