| Param | Original file | Final file |
|---|---|---|
| Filename | modeM0/AS1G06_091T01_9000000880cztM0_level2.evt | modeM0/AS1G06_091T01_9000000880cztM0_level2_quad_clean.evt |
| Size (bytes) | 4,639,711,680 | 1,007,524,800 |
| Size | 4.3 GB | 960.9 MB |
| Events in quadrant A | 36,348,658 | 6,489,696 |
| Events in quadrant B | 34,391,295 | 6,626,499 |
| Events in quadrant C | 29,497,728 | 6,605,545 |
| Events in quadrant D | 35,800,310 | 6,248,663 |
| Mode SS | |||
|---|---|---|---|
| Quadrant | BADHDUFLAG | Total packets | Discarded packets |
| A | 0 | 1348 | 0 |
| B | 0 | 1346 | 0 |
| C | 0 | 1352 | 0 |
| D | 0 | 1354 | 0 |
| Mode M0 | |||
|---|---|---|---|
| Quadrant | BADHDUFLAG | Total packets | Discarded packets |
| A | 0 | 153441 | 0 |
| B | 0 | 147437 | 0 |
| C | 0 | 135715 | 0 |
| D | 0 | 153630 | 0 |
| Mode M9 | |||
|---|---|---|---|
| Quadrant | BADHDUFLAG | Total packets | Discarded packets |
| A | 0 | 110 | 0 |
| B | 0 | 109 | 0 |
| C | 0 | 110 | 0 |
| D | 0 | 110 | 0 |
| Quadrant | Total seconds | Saturated seconds | Saturation percentage |
|---|---|---|---|
| A | 66295 | 2182 | 3.291349% |
| B | 66307 | 1869 | 2.818707% |
| C | 66341 | 768 | 1.157655% |
| D | 66284 | 2086 | 3.147064% |
Noise dominated data is calculated using 1-second bins in cleaned event files. If a bin has >2000 counts, and if more than 50% of those come from <1% of pixels, then it is considered to be noise-dominated and hence unusable.
| Quadrant | # 1 sec bins | Bins with >0 counts | Bins with >2000 counts | High rate bins dominated by noise | Noise dominated (total time) | Noise dominated (detector-on time) | Marked lightcurve |
|---|---|---|---|---|---|---|---|
| A | 77612 | 66773 | 712 | 712 | 0.92% | 1.07% | 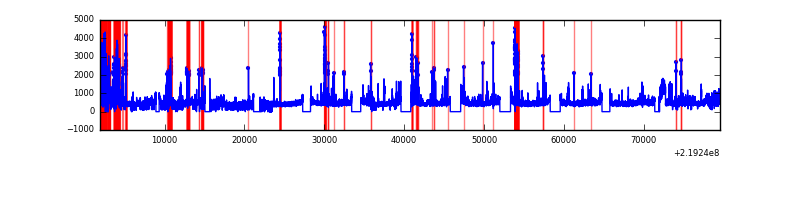 |
| B | 77612 | 66763 | 503 | 503 | 0.65% | 0.75% |  |
| C | 77612 | 66774 | 3 | 3 | 0.00% | 0.00% | 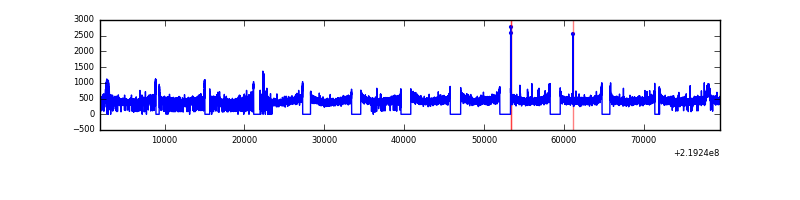 |
| D | 77612 | 66765 | 889 | 889 | 1.15% | 1.33% |  |
Top three noisy pixels from each quadrant. If the there are fewer than three noisy pixels in the level2.evt file, extra rows are filled as -1
| Pixel properties | Quadrant properties | ||||||
|---|---|---|---|---|---|---|---|
| Quadrant | DetID | PixID | Counts | Sigma | Mean | Median | Sigma |
| A | 15 | 236 | 5254779 | 3453.29 | 7556 | 7401 | 1519.5 |
| A | 13 | 251 | 881517 | 575.25 | 7556 | 7401 | 1519.5 |
| A | 8 | 15 | 626014 | 407.11 | 7556 | 7401 | 1519.5 |
| B | 4 | 170 | 1210746 | 840.83 | 7686 | 7503 | 1431.0 |
| B | 4 | 48 | 995710 | 690.56 | 7686 | 7503 | 1431.0 |
| B | 0 | 219 | 747149 | 516.87 | 7686 | 7503 | 1431.0 |
| C | 1 | 16 | 67060 | 34.41 | 7528 | 7553 | 1729.3 |
| C | 13 | 61 | 59618 | 30.11 | 7528 | 7553 | 1729.3 |
| C | 8 | 128 | 33336 | 14.91 | 7528 | 7553 | 1729.3 |
| D | 2 | 33 | 3179557 | 1753.65 | 7432 | 7204 | 1809.0 |
| D | 2 | 152 | 1307213 | 718.63 | 7432 | 7204 | 1809.0 |
| D | 2 | 63 | 840116 | 460.43 | 7432 | 7204 | 1809.0 |
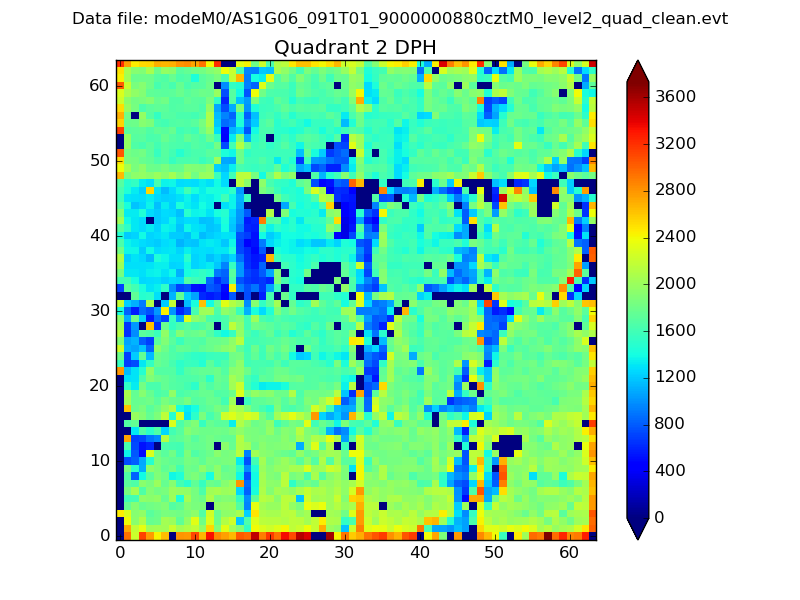
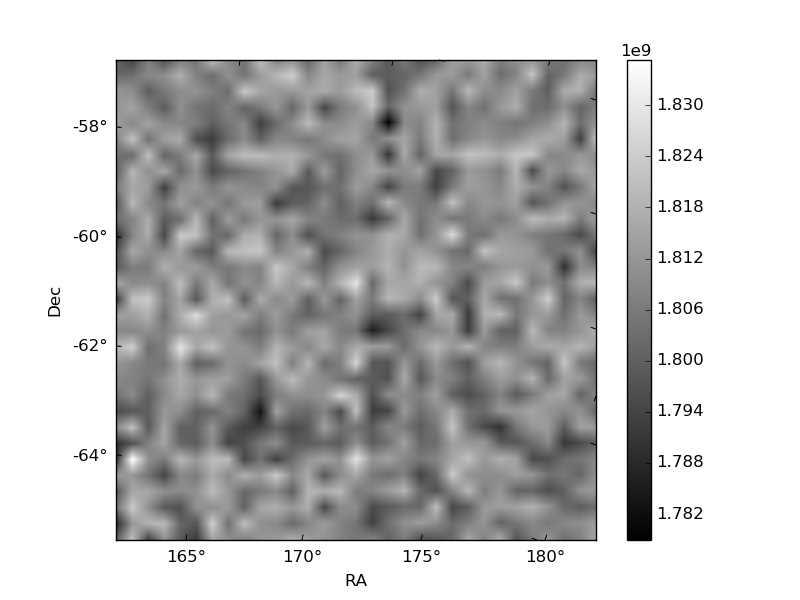
Histogram calculated using DETX and DETY for each event in the final _common_clean file
| Quadrant A |  |
 |
Quadrant B |
|---|---|---|---|
| Quadrant D |  |
 |
Quadrant C |
| Plot type | Count rate plots | Images |
|---|---|---|
| Comparison with Poisson distribution Blue bars denote a histogram of data divided into 1 sec bins. Red curve is a Poisson curve with rate = median count rate of data. |
 |
 |
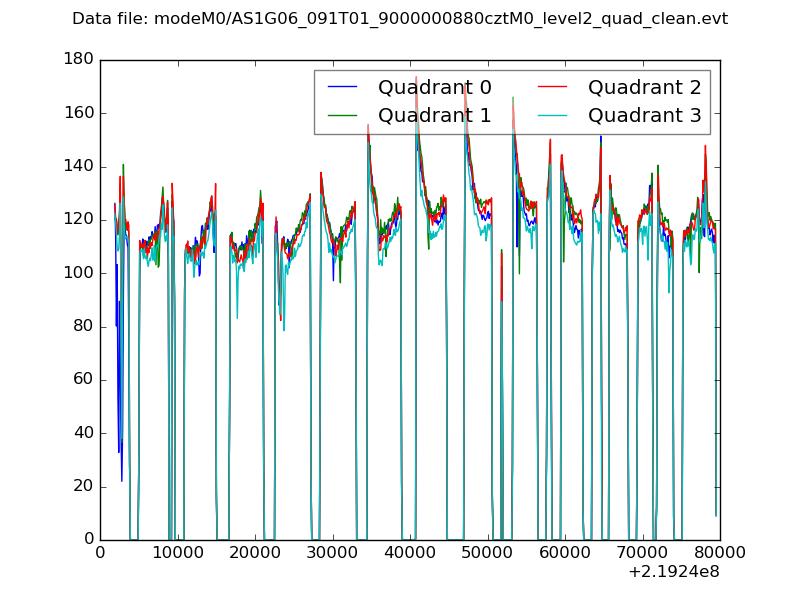
| Quadrant-wise count rates Data is divided into 100 sec bins |
 |
|
| Module-wise count rates for Quadrant A Data is divided into 100 sec bins |
 |
 |
| Module-wise count rates for Quadrant B Data is divided into 100 sec bins |
 |
 |
| Module-wise count rates for Quadrant C Data is divided into 100 sec bins |
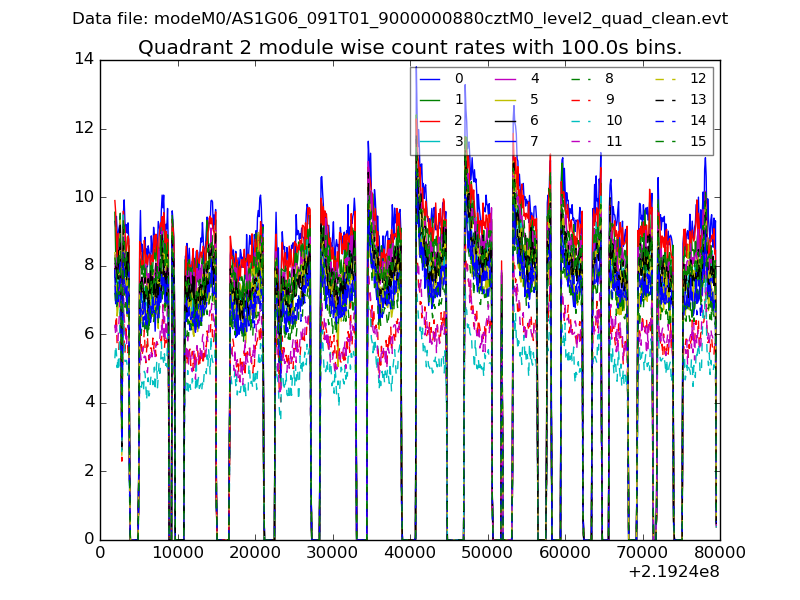 |
 |
| Module-wise count rates for Quadrant D Data is divided into 100 sec bins |
 |
 |
| Parameter | Plot |
|---|---|
| CZT HV Monitor | 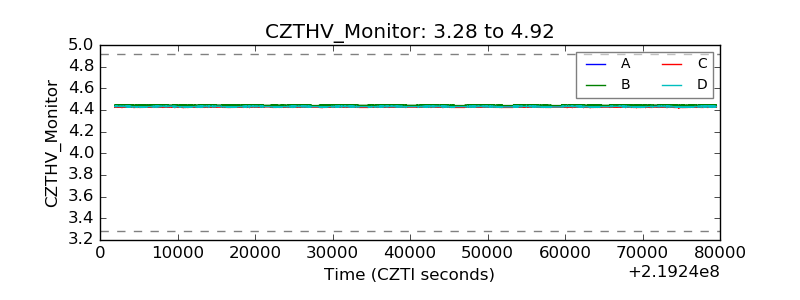 |
| D_VDD | 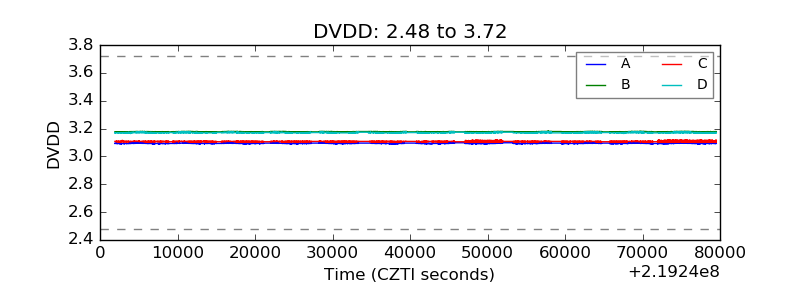 |
| Temperature 1 |  |
| Veto HV Monitor | 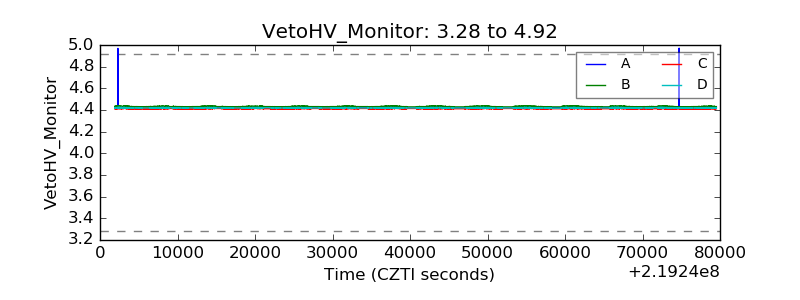 |
| Veto LLD |  |
| Alpha Counter |  |
| _CPM_Rate | 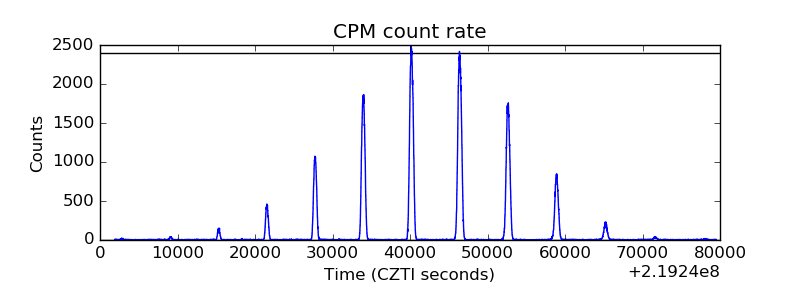 |
| CZT Counter |  |
| +2.5 Volts monitor |  |
| +5 Volts monitor |  |
| _ROLL_ROT |  |
| _Roll_DEC |  |
| _Roll_RA |  |
| Veto Counter |  |