| Param | Original file | Final file |
|---|---|---|
| Filename | modeM0/AS1G06_136T02_9000000876cztM0_level2.evt | modeM0/AS1G06_136T02_9000000876cztM0_level2_quad_clean.evt |
| Size (bytes) | 7,392,044,160 | 1,369,549,440 |
| Size | 6.9 GB | 1.3 GB |
| Events in quadrant A | 51,766,780 | 8,572,001 |
| Events in quadrant B | 55,261,826 | 8,732,376 |
| Events in quadrant C | 49,021,947 | 8,579,918 |
| Events in quadrant D | 60,489,509 | 8,155,010 |
| Mode M0 | |||
|---|---|---|---|
| Quadrant | BADHDUFLAG | Total packets | Discarded packets |
| A | 0 | 229646 | 0 |
| B | 0 | 238161 | 0 |
| C | 0 | 224572 | 0 |
| D | 0 | 257012 | 0 |
| Mode SS | |||
|---|---|---|---|
| Quadrant | BADHDUFLAG | Total packets | Discarded packets |
| A | 0 | 2208 | 0 |
| B | 0 | 2208 | 0 |
| C | 0 | 2208 | 0 |
| D | 0 | 2208 | 0 |
| Mode M9 | |||
|---|---|---|---|
| Quadrant | BADHDUFLAG | Total packets | Discarded packets |
| A | 0 | 187 | 0 |
| B | 0 | 187 | 0 |
| C | 0 | 187 | 0 |
| D | 0 | 187 | 0 |
| Quadrant | Total seconds | Saturated seconds | Saturation percentage |
|---|---|---|---|
| A | 108633 | 1456 | 1.340293% |
| B | 108628 | 1981 | 1.823655% |
| C | 108630 | 879 | 0.809169% |
| D | 108630 | 2048 | 1.885299% |
Noise dominated data is calculated using 1-second bins in cleaned event files. If a bin has >2000 counts, and if more than 50% of those come from <1% of pixels, then it is considered to be noise-dominated and hence unusable.
| Quadrant | # 1 sec bins | Bins with >0 counts | Bins with >2000 counts | High rate bins dominated by noise | Noise dominated (total time) | Noise dominated (detector-on time) | Marked lightcurve |
|---|---|---|---|---|---|---|---|
| A | 127192 | 108664 | 110 | 110 | 0.09% | 0.10% |  |
| B | 127192 | 108664 | 594 | 594 | 0.47% | 0.55% |  |
| C | 127192 | 108664 | 130 | 130 | 0.10% | 0.12% |  |
| D | 127192 | 108664 | 973 | 973 | 0.76% | 0.90% |  |
Top three noisy pixels from each quadrant. If the there are fewer than three noisy pixels in the level2.evt file, extra rows are filled as -1
| Pixel properties | Quadrant properties | ||||||
|---|---|---|---|---|---|---|---|
| Quadrant | DetID | PixID | Counts | Sigma | Mean | Median | Sigma |
| A | 15 | 236 | 2204611 | 866.8 | 12606 | 12331 | 2529.2 |
| A | 8 | 15 | 591964 | 229.18 | 12606 | 12331 | 2529.2 |
| A | 15 | 234 | 359781 | 137.38 | 12606 | 12331 | 2529.2 |
| B | 5 | 143 | 2328085 | 971.65 | 12690 | 12397 | 2383.3 |
| B | 4 | 48 | 689543 | 284.13 | 12690 | 12397 | 2383.3 |
| B | 0 | 228 | 661192 | 272.23 | 12690 | 12397 | 2383.3 |
| C | 9 | 237 | 914031 | 322.28 | 12220 | 12268 | 2798.1 |
| C | 4 | 254 | 169623 | 56.24 | 12220 | 12268 | 2798.1 |
| C | 1 | 16 | 125187 | 40.36 | 12220 | 12268 | 2798.1 |
| D | 2 | 152 | 3941586 | 1329.28 | 12177 | 11796 | 2956.3 |
| D | 13 | 137 | 2175069 | 731.74 | 12177 | 11796 | 2956.3 |
| D | 2 | 136 | 1859223 | 624.91 | 12177 | 11796 | 2956.3 |
Histogram calculated using DETX and DETY for each event in the final _common_clean file
| Quadrant A | 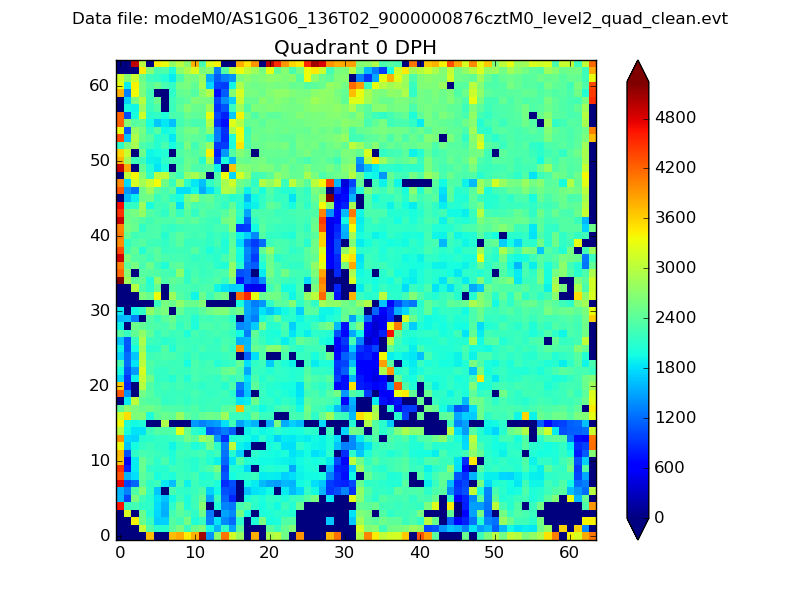 |
 |
Quadrant B |
|---|---|---|---|
| Quadrant D |  |
 |
Quadrant C |
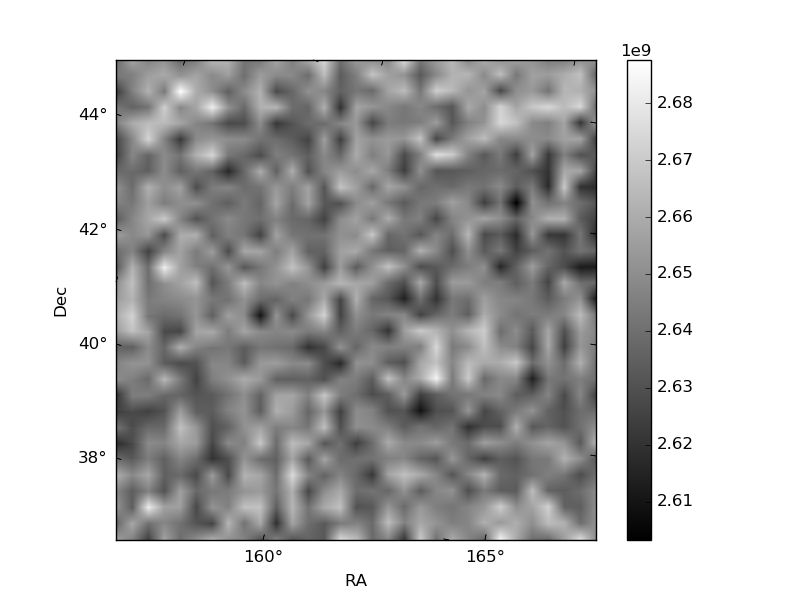
| Plot type | Count rate plots | Images |
|---|---|---|
| Comparison with Poisson distribution Blue bars denote a histogram of data divided into 1 sec bins. Red curve is a Poisson curve with rate = median count rate of data. |
 |
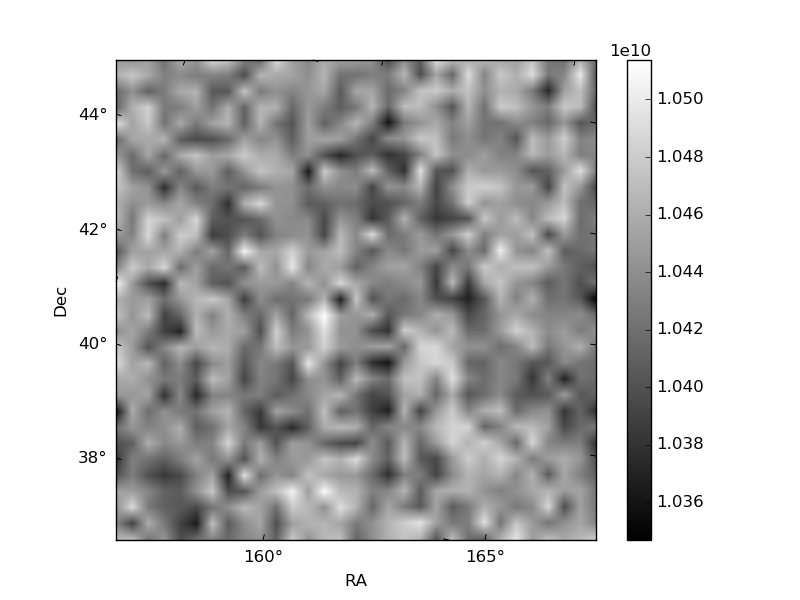 |
| Quadrant-wise count rates Data is divided into 100 sec bins |
 |
|
| Module-wise count rates for Quadrant A Data is divided into 100 sec bins |
 |
 |
| Module-wise count rates for Quadrant B Data is divided into 100 sec bins |
 |
 |
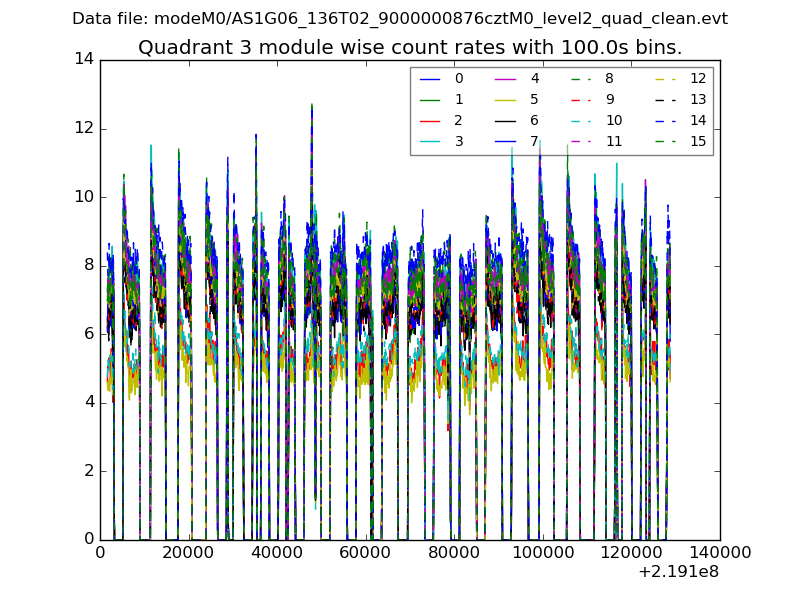
| Module-wise count rates for Quadrant C Data is divided into 100 sec bins |
 |
 |
| Module-wise count rates for Quadrant D Data is divided into 100 sec bins |
 |
 |
| Parameter | Plot |
|---|---|
| CZT HV Monitor |  |
| D_VDD |  |
| Temperature 1 |  |
| Veto HV Monitor |  |
| Veto LLD |  |
| Alpha Counter |  |
| _CPM_Rate |  |
| CZT Counter |  |
| +2.5 Volts monitor |  |
| +5 Volts monitor |  |
| _ROLL_ROT | 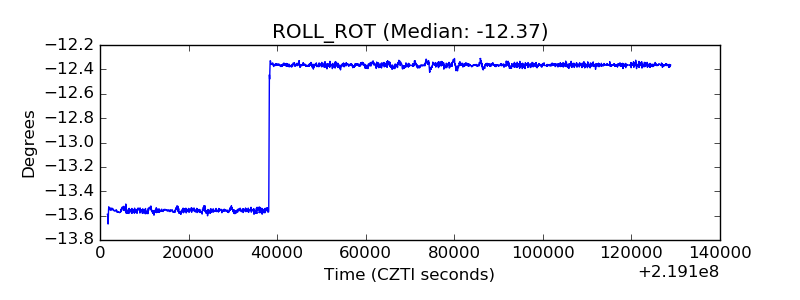 |
| _Roll_DEC |  |
| _Roll_RA |  |
| Veto Counter |  |