| Param | Original file | Final file |
|---|---|---|
| Filename | modeM0/AS1G06_164T01_9000000866cztM0_level2.evt | modeM0/AS1G06_164T01_9000000866cztM0_level2_quad_clean.evt |
| Size (bytes) | 1,867,308,480 | 411,730,560 |
| Size | 1.7 GB | 392.7 MB |
| Events in quadrant A | 13,289,943 | 2,669,522 |
| Events in quadrant B | 13,715,174 | 2,642,144 |
| Events in quadrant C | 12,408,162 | 2,620,477 |
| Events in quadrant D | 15,193,829 | 2,562,172 |
| Mode M0 | |||
|---|---|---|---|
| Quadrant | BADHDUFLAG | Total packets | Discarded packets |
| A | 0 | 60222 | 0 |
| B | 0 | 60943 | 0 |
| C | 0 | 58730 | 0 |
| D | 0 | 64080 | 0 |
| Mode M9 | |||
|---|---|---|---|
| Quadrant | BADHDUFLAG | Total packets | Discarded packets |
| A | 0 | 16 | 0 |
| B | 0 | 16 | 0 |
| C | 0 | 16 | 0 |
| D | 0 | 16 | 0 |
| Mode SS | |||
|---|---|---|---|
| Quadrant | BADHDUFLAG | Total packets | Discarded packets |
| A | 0 | 582 | 0 |
| B | 0 | 582 | 0 |
| C | 0 | 582 | 0 |
| D | 0 | 582 | 0 |
| Quadrant | Total seconds | Saturated seconds | Saturation percentage |
|---|---|---|---|
| A | 28758 | 769 | 2.674039% |
| B | 28758 | 813 | 2.827039% |
| C | 28758 | 505 | 1.756033% |
| D | 28758 | 727 | 2.527992% |
Noise dominated data is calculated using 1-second bins in cleaned event files. If a bin has >2000 counts, and if more than 50% of those come from <1% of pixels, then it is considered to be noise-dominated and hence unusable.
| Quadrant | # 1 sec bins | Bins with >0 counts | Bins with >2000 counts | High rate bins dominated by noise | Noise dominated (total time) | Noise dominated (detector-on time) | Marked lightcurve |
|---|---|---|---|---|---|---|---|
| A | 30228 | 28765 | 44 | 44 | 0.15% | 0.15% |  |
| B | 30228 | 28765 | 72 | 72 | 0.24% | 0.25% |  |
| C | 30228 | 28765 | 0 | 0 | 0.00% | 0.00% | 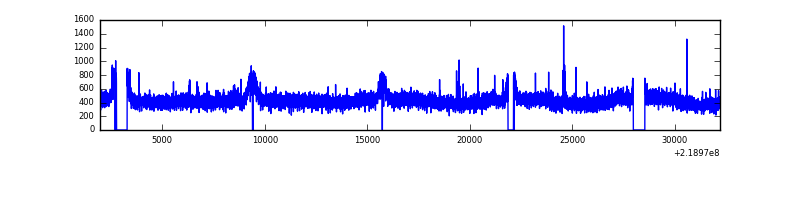 |
| D | 30228 | 28765 | 124 | 124 | 0.41% | 0.43% |  |
Top three noisy pixels from each quadrant. If the there are fewer than three noisy pixels in the level2.evt file, extra rows are filled as -1
| Pixel properties | Quadrant properties | ||||||
|---|---|---|---|---|---|---|---|
| Quadrant | DetID | PixID | Counts | Sigma | Mean | Median | Sigma |
| A | 8 | 15 | 338389 | 505.48 | 3271 | 3199 | 663.1 |
| A | 15 | 234 | 101477 | 148.21 | 3271 | 3199 | 663.1 |
| A | 15 | 174 | 98326 | 143.46 | 3271 | 3199 | 663.1 |
| B | 0 | 219 | 275801 | 439.41 | 3277 | 3193 | 620.4 |
| B | 0 | 214 | 189246 | 299.9 | 3277 | 3193 | 620.4 |
| B | 3 | 220 | 136435 | 214.77 | 3277 | 3193 | 620.4 |
| C | 12 | 4 | 25611 | 31.0 | 3161 | 3168 | 724.0 |
| C | 13 | 61 | 25186 | 30.41 | 3161 | 3168 | 724.0 |
| C | 7 | 247 | 18250 | 20.83 | 3161 | 3168 | 724.0 |
| D | 8 | 195 | 1270881 | 1656.55 | 3167 | 3062 | 765.3 |
| D | 2 | 152 | 880818 | 1146.89 | 3167 | 3062 | 765.3 |
| D | 2 | 63 | 264321 | 341.36 | 3167 | 3062 | 765.3 |
Histogram calculated using DETX and DETY for each event in the final _common_clean file
| Quadrant A |  |
 |
Quadrant B |
|---|---|---|---|
| Quadrant D | 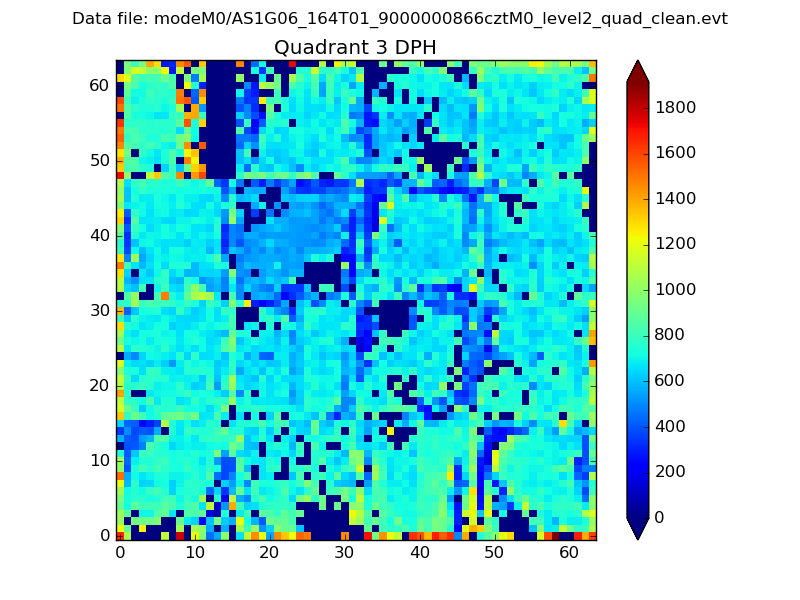 |
 |
Quadrant C |
| Plot type | Count rate plots | Images |
|---|---|---|
| Comparison with Poisson distribution Blue bars denote a histogram of data divided into 1 sec bins. Red curve is a Poisson curve with rate = median count rate of data. |
 |
 |
| Quadrant-wise count rates Data is divided into 100 sec bins |
 |
|
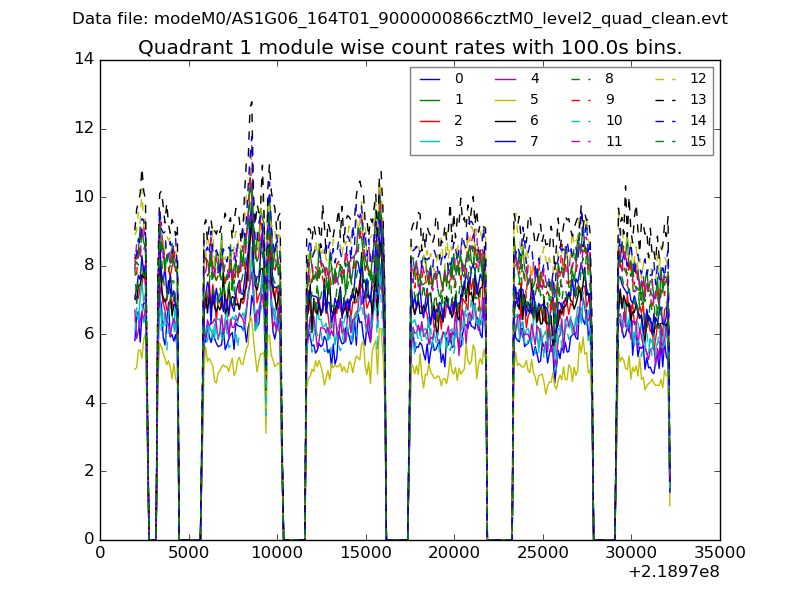
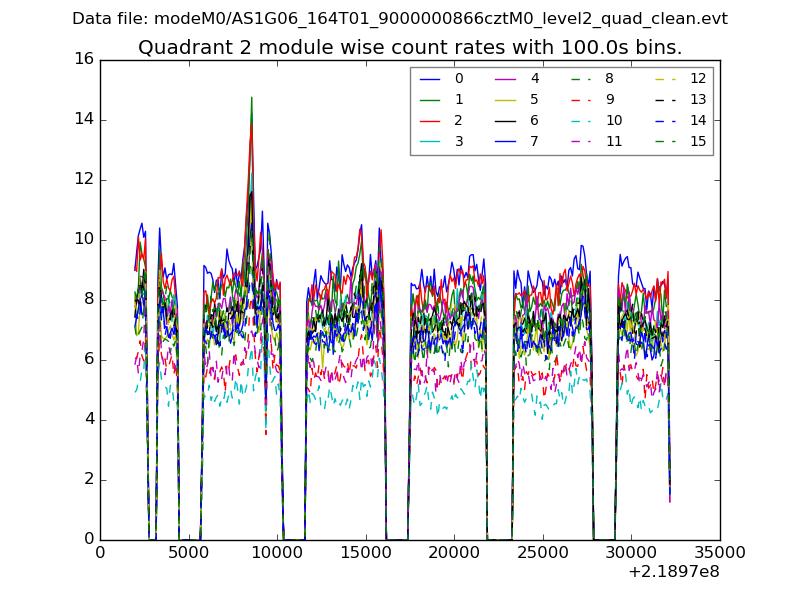
| Module-wise count rates for Quadrant A Data is divided into 100 sec bins |
 |
 |
| Module-wise count rates for Quadrant B Data is divided into 100 sec bins |
 |
 |
| Module-wise count rates for Quadrant C Data is divided into 100 sec bins |
 |
 |
| Module-wise count rates for Quadrant D Data is divided into 100 sec bins |
 |
 |
| Parameter | Plot |
|---|---|
| CZT HV Monitor |  |
| D_VDD |  |
| Temperature 1 | 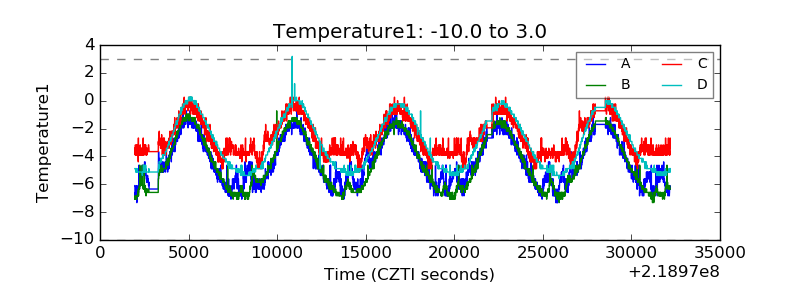 |
| Veto HV Monitor |  |
| Veto LLD |  |
| Alpha Counter |  |
| _CPM_Rate |  |
| CZT Counter |  |
| +2.5 Volts monitor |  |
| +5 Volts monitor |  |
| _ROLL_ROT |  |
| _Roll_DEC |  |
| _Roll_RA | 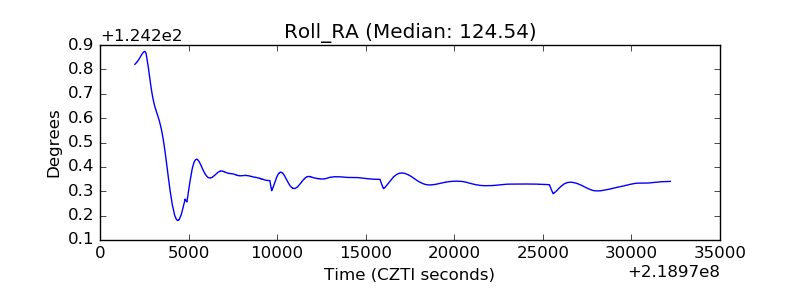 |
| Veto Counter |  |