| Param | Original file | Final file |
|---|---|---|
| Filename | modeM0/AS1G06_134T11_9000000870cztM0_level2.evt | modeM0/AS1G06_134T11_9000000870cztM0_level2_quad_clean.evt |
| Size (bytes) | 2,134,123,200 | 466,943,040 |
| Size | 2.0 GB | 445.3 MB |
| Events in quadrant A | 14,980,887 | 2,995,739 |
| Events in quadrant B | 15,254,734 | 3,074,597 |
| Events in quadrant C | 14,187,058 | 2,996,554 |
| Events in quadrant D | 18,003,979 | 2,834,914 |
| Mode SS | |||
|---|---|---|---|
| Quadrant | BADHDUFLAG | Total packets | Discarded packets |
| A | 0 | 668 | 0 |
| B | 0 | 668 | 0 |
| C | 0 | 668 | 0 |
| D | 0 | 668 | 0 |
| Mode M0 | |||
|---|---|---|---|
| Quadrant | BADHDUFLAG | Total packets | Discarded packets |
| A | 0 | 67925 | 0 |
| B | 0 | 68023 | 0 |
| C | 0 | 66660 | 0 |
| D | 0 | 76319 | 0 |
| Mode M9 | |||
|---|---|---|---|
| Quadrant | BADHDUFLAG | Total packets | Discarded packets |
| A | 0 | 69 | 0 |
| B | 0 | 69 | 0 |
| C | 0 | 69 | 0 |
| D | 0 | 69 | 0 |
| Quadrant | Total seconds | Saturated seconds | Saturation percentage |
|---|---|---|---|
| A | 32621 | 481 | 1.474510% |
| B | 32621 | 261 | 0.800098% |
| C | 32621 | 85 | 0.260568% |
| D | 32621 | 564 | 1.728948% |
Noise dominated data is calculated using 1-second bins in cleaned event files. If a bin has >2000 counts, and if more than 50% of those come from <1% of pixels, then it is considered to be noise-dominated and hence unusable.
| Quadrant | # 1 sec bins | Bins with >0 counts | Bins with >2000 counts | High rate bins dominated by noise | Noise dominated (total time) | Noise dominated (detector-on time) | Marked lightcurve |
|---|---|---|---|---|---|---|---|
| A | 39600 | 32626 | 17 | 17 | 0.04% | 0.05% |  |
| B | 39600 | 32626 | 33 | 33 | 0.08% | 0.10% |  |
| C | 39600 | 32626 | 0 | 0 | 0.00% | 0.00% |  |
| D | 39600 | 32626 | 308 | 308 | 0.78% | 0.94% |  |
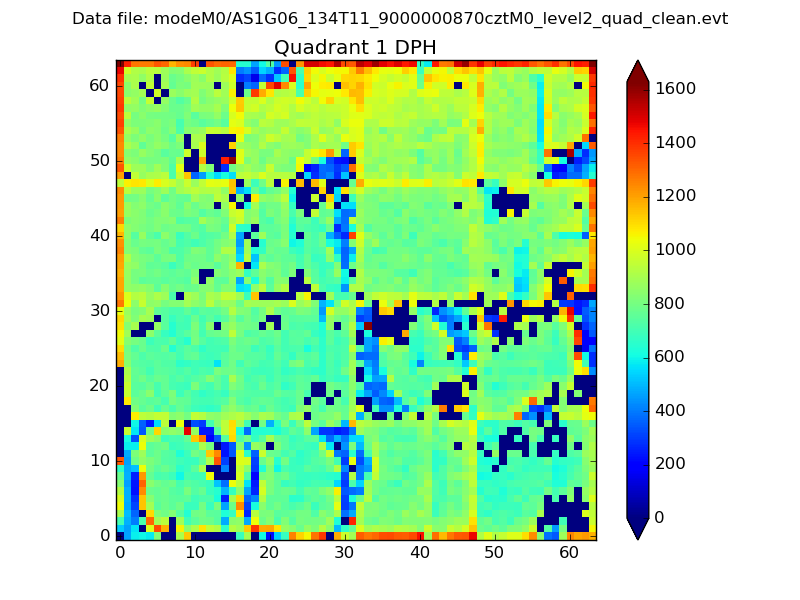
Top three noisy pixels from each quadrant. If the there are fewer than three noisy pixels in the level2.evt file, extra rows are filled as -1
| Pixel properties | Quadrant properties | ||||||
|---|---|---|---|---|---|---|---|
| Quadrant | DetID | PixID | Counts | Sigma | Mean | Median | Sigma |
| A | 15 | 236 | 444783 | 593.47 | 3739 | 3664 | 743.3 |
| A | 8 | 15 | 117597 | 153.28 | 3739 | 3664 | 743.3 |
| A | 0 | 226 | 36489 | 44.16 | 3739 | 3664 | 743.3 |
| B | 4 | 81 | 145788 | 203.95 | 3768 | 3683 | 696.8 |
| B | 0 | 219 | 112864 | 156.7 | 3768 | 3683 | 696.8 |
| B | 4 | 80 | 108373 | 150.25 | 3768 | 3683 | 696.8 |
| C | 1 | 16 | 87112 | 102.55 | 3603 | 3621 | 814.1 |
| C | 13 | 61 | 29077 | 31.27 | 3603 | 3621 | 814.1 |
| C | 14 | 67 | 23701 | 24.66 | 3603 | 3621 | 814.1 |
| D | 8 | 195 | 1420719 | 1644.38 | 3588 | 3473 | 861.9 |
| D | 2 | 152 | 1221985 | 1413.79 | 3588 | 3473 | 861.9 |
| D | 2 | 33 | 387480 | 445.55 | 3588 | 3473 | 861.9 |
Histogram calculated using DETX and DETY for each event in the final _common_clean file
| Quadrant A |  |
 |
Quadrant B |
|---|---|---|---|
| Quadrant D |  |
 |
Quadrant C |
| Plot type | Count rate plots | Images |
|---|---|---|
| Comparison with Poisson distribution Blue bars denote a histogram of data divided into 1 sec bins. Red curve is a Poisson curve with rate = median count rate of data. |
 |
 |
| Quadrant-wise count rates Data is divided into 100 sec bins |
 |
|
| Module-wise count rates for Quadrant A Data is divided into 100 sec bins |
 |
 |
| Module-wise count rates for Quadrant B Data is divided into 100 sec bins |
 |
 |
| Module-wise count rates for Quadrant C Data is divided into 100 sec bins |
 |
 |
| Module-wise count rates for Quadrant D Data is divided into 100 sec bins |
 |
 |
| Parameter | Plot |
|---|---|
| CZT HV Monitor |  |
| D_VDD |  |
| Temperature 1 |  |
| Veto HV Monitor |  |
| Veto LLD |  |
| Alpha Counter |  |
| _CPM_Rate |  |
| CZT Counter | 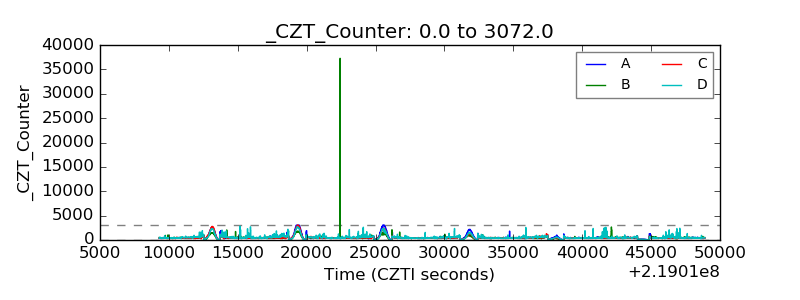 |
| +2.5 Volts monitor |  |
| +5 Volts monitor |  |
| _ROLL_ROT |  |
| _Roll_DEC |  |
| _Roll_RA |  |
| Veto Counter |  |