| Param | Original file | Final file |
|---|---|---|
| Filename | modeM0/AS1A02_046T01_9000000864cztM0_level2.evt | modeM0/AS1A02_046T01_9000000864cztM0_level2_quad_clean.evt |
| Size (bytes) | 3,330,408,960 | 953,110,080 |
| Size | 3.1 GB | 909.0 MB |
| Events in quadrant A | 24,046,300 | 6,427,167 |
| Events in quadrant B | 25,084,190 | 6,452,646 |
| Events in quadrant C | 22,793,240 | 6,312,556 |
| Events in quadrant D | 25,421,173 | 6,108,692 |
| Mode M9 | |||
|---|---|---|---|
| Quadrant | BADHDUFLAG | Total packets | Discarded packets |
| A | 0 | 101 | 0 |
| B | 0 | 101 | 0 |
| C | 0 | 101 | 0 |
| D | 0 | 101 | 0 |
| Mode SS | |||
|---|---|---|---|
| Quadrant | BADHDUFLAG | Total packets | Discarded packets |
| A | 0 | 1062 | 0 |
| B | 0 | 1062 | 0 |
| C | 0 | 1062 | 0 |
| D | 0 | 1062 | 0 |
| Mode M0 | |||
|---|---|---|---|
| Quadrant | BADHDUFLAG | Total packets | Discarded packets |
| A | 0 | 108318 | 0 |
| B | 0 | 110633 | 0 |
| C | 0 | 106578 | 0 |
| D | 0 | 112470 | 0 |
| Quadrant | Total seconds | Saturated seconds | Saturation percentage |
|---|---|---|---|
| A | 52053 | 458 | 0.879872% |
| B | 52053 | 534 | 1.025877% |
| C | 52053 | 219 | 0.420725% |
| D | 52053 | 407 | 0.781895% |
Noise dominated data is calculated using 1-second bins in cleaned event files. If a bin has >2000 counts, and if more than 50% of those come from <1% of pixels, then it is considered to be noise-dominated and hence unusable.
| Quadrant | # 1 sec bins | Bins with >0 counts | Bins with >2000 counts | High rate bins dominated by noise | Noise dominated (total time) | Noise dominated (detector-on time) | Marked lightcurve |
|---|---|---|---|---|---|---|---|
| A | 62178 | 52065 | 135 | 135 | 0.22% | 0.26% | 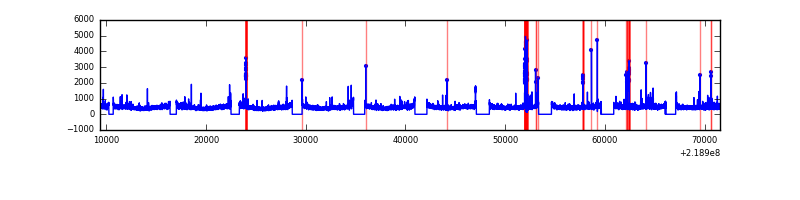 |
| B | 62178 | 52065 | 164 | 164 | 0.26% | 0.31% |  |
| C | 62178 | 52065 | 26 | 26 | 0.04% | 0.05% |  |
| D | 62178 | 52065 | 119 | 119 | 0.19% | 0.23% | 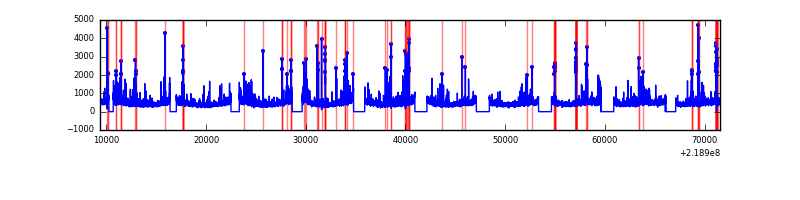 |
Top three noisy pixels from each quadrant. If the there are fewer than three noisy pixels in the level2.evt file, extra rows are filled as -1
| Pixel properties | Quadrant properties | ||||||
|---|---|---|---|---|---|---|---|
| Quadrant | DetID | PixID | Counts | Sigma | Mean | Median | Sigma |
| A | 15 | 234 | 309023 | 254.53 | 5954 | 5833 | 1191.2 |
| A | 8 | 15 | 274935 | 225.91 | 5954 | 5833 | 1191.2 |
| A | 15 | 236 | 267596 | 219.75 | 5954 | 5833 | 1191.2 |
| B | 0 | 219 | 574743 | 510.88 | 5980 | 5835 | 1113.6 |
| B | 15 | 204 | 225389 | 197.16 | 5980 | 5835 | 1113.6 |
| B | 0 | 228 | 205878 | 179.64 | 5980 | 5835 | 1113.6 |
| C | 1 | 16 | 358429 | 270.02 | 5735 | 5749 | 1306.1 |
| C | 13 | 61 | 45331 | 30.3 | 5735 | 5749 | 1306.1 |
| C | 12 | 4 | 38897 | 25.38 | 5735 | 5749 | 1306.1 |
| D | 2 | 152 | 1250835 | 899.12 | 5760 | 5572 | 1385.0 |
| D | 8 | 195 | 1059687 | 761.1 | 5760 | 5572 | 1385.0 |
| D | 2 | 14 | 281381 | 199.14 | 5760 | 5572 | 1385.0 |
Histogram calculated using DETX and DETY for each event in the final _common_clean file
| Quadrant A |  |
 |
Quadrant B |
|---|---|---|---|
| Quadrant D |  |
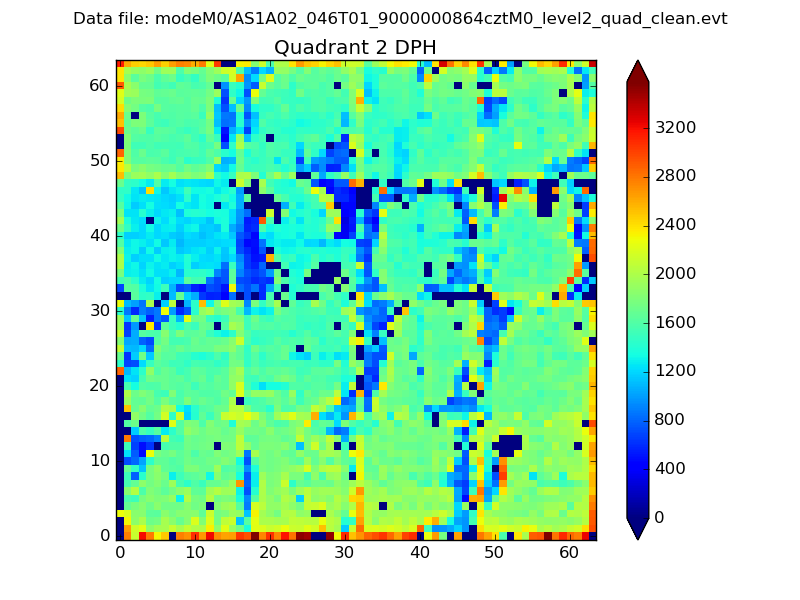 |
Quadrant C |
| Plot type | Count rate plots | Images |
|---|---|---|
| Comparison with Poisson distribution Blue bars denote a histogram of data divided into 1 sec bins. Red curve is a Poisson curve with rate = median count rate of data. |
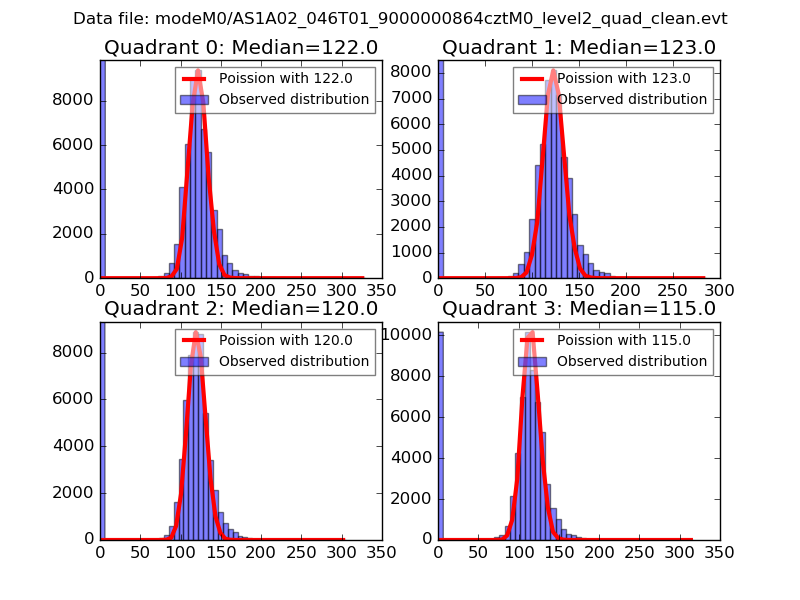 |
 |
| Quadrant-wise count rates Data is divided into 100 sec bins |
 |
|
| Module-wise count rates for Quadrant A Data is divided into 100 sec bins |
 |
 |
| Module-wise count rates for Quadrant B Data is divided into 100 sec bins |
 |
 |
| Module-wise count rates for Quadrant C Data is divided into 100 sec bins |
 |
 |
| Module-wise count rates for Quadrant D Data is divided into 100 sec bins |
 |
 |
| Parameter | Plot |
|---|---|
| CZT HV Monitor |  |
| D_VDD |  |
| Temperature 1 |  |
| Veto HV Monitor |  |
| Veto LLD |  |
| Alpha Counter | 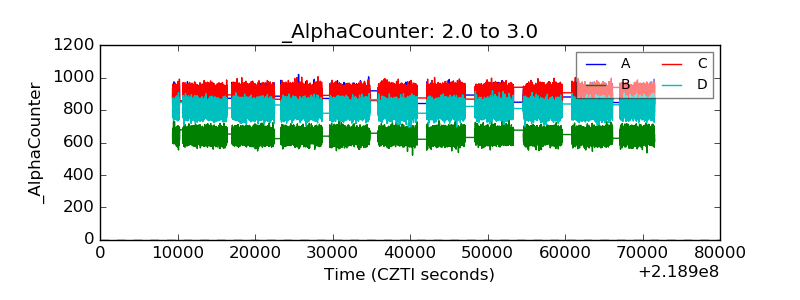 |
| _CPM_Rate | 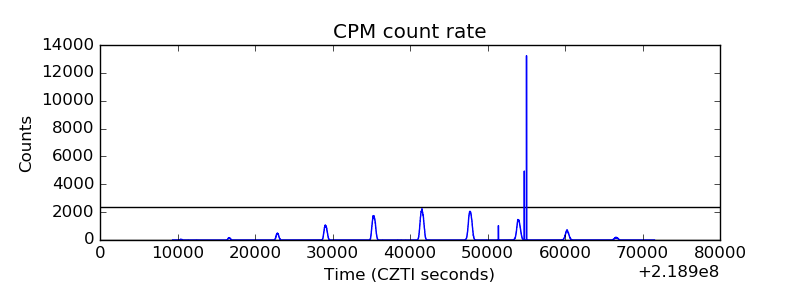 |
| CZT Counter |  |
| +2.5 Volts monitor |  |
| +5 Volts monitor | 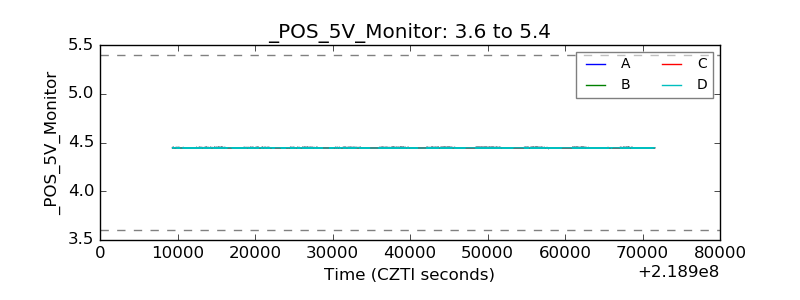 |
| _ROLL_ROT |  |
| _Roll_DEC |  |
| _Roll_RA |  |
| Veto Counter |  |