| Param | Original file | Final file |
|---|---|---|
| Filename | modeM0/AS1G06_139T02_9000000862cztM0_level2.evt | modeM0/AS1G06_139T02_9000000862cztM0_level2_quad_clean.evt |
| Size (bytes) | 4,191,569,280 | 718,352,640 |
| Size | 3.9 GB | 685.1 MB |
| Events in quadrant A | 33,044,951 | 4,454,091 |
| Events in quadrant B | 29,719,800 | 4,488,872 |
| Events in quadrant C | 28,707,182 | 4,395,172 |
| Events in quadrant D | 31,360,423 | 4,242,666 |
| Mode M0 | |||
|---|---|---|---|
| Quadrant | BADHDUFLAG | Total packets | Discarded packets |
| A | 0 | 139315 | 0 |
| B | 0 | 127848 | 0 |
| C | 0 | 127289 | 0 |
| D | 0 | 134069 | 0 |
| Mode M9 | |||
|---|---|---|---|
| Quadrant | BADHDUFLAG | Total packets | Discarded packets |
| A | 0 | 95 | 0 |
| B | 0 | 95 | 0 |
| C | 0 | 95 | 0 |
| D | 0 | 95 | 0 |
| Mode SS | |||
|---|---|---|---|
| Quadrant | BADHDUFLAG | Total packets | Discarded packets |
| A | 0 | 1238 | 0 |
| B | 0 | 1238 | 0 |
| C | 0 | 1238 | 0 |
| D | 0 | 1238 | 0 |
| Quadrant | Total seconds | Saturated seconds | Saturation percentage |
|---|---|---|---|
| A | 60906 | 1119 | 1.837257% |
| B | 60906 | 996 | 1.635307% |
| C | 60905 | 548 | 0.899762% |
| D | 60906 | 953 | 1.564706% |
Noise dominated data is calculated using 1-second bins in cleaned event files. If a bin has >2000 counts, and if more than 50% of those come from <1% of pixels, then it is considered to be noise-dominated and hence unusable.
| Quadrant | # 1 sec bins | Bins with >0 counts | Bins with >2000 counts | High rate bins dominated by noise | Noise dominated (total time) | Noise dominated (detector-on time) | Marked lightcurve |
|---|---|---|---|---|---|---|---|
| A | 70436 | 60917 | 22 | 22 | 0.03% | 0.04% |  |
| B | 70436 | 60917 | 21 | 21 | 0.03% | 0.03% |  |
| C | 70436 | 60917 | 38 | 38 | 0.05% | 0.06% |  |
| D | 70436 | 60917 | 184 | 184 | 0.26% | 0.30% |  |
Top three noisy pixels from each quadrant. If the there are fewer than three noisy pixels in the level2.evt file, extra rows are filled as -1
| Pixel properties | Quadrant properties | ||||||
|---|---|---|---|---|---|---|---|
| Quadrant | DetID | PixID | Counts | Sigma | Mean | Median | Sigma |
| A | 15 | 236 | 4327372 | 2900.9 | 7354 | 7199 | 1489.3 |
| A | 8 | 15 | 225084 | 146.3 | 7354 | 7199 | 1489.3 |
| A | 15 | 174 | 117290 | 73.92 | 7354 | 7199 | 1489.3 |
| B | 4 | 81 | 242196 | 166.97 | 7410 | 7249 | 1407.1 |
| B | 15 | 204 | 186614 | 127.47 | 7410 | 7249 | 1407.1 |
| B | 0 | 228 | 175097 | 119.28 | 7410 | 7249 | 1407.1 |
| C | 1 | 16 | 753636 | 453.54 | 7131 | 7173 | 1645.9 |
| C | 12 | 4 | 57804 | 30.76 | 7131 | 7173 | 1645.9 |
| C | 13 | 61 | 56093 | 29.72 | 7131 | 7173 | 1645.9 |
| D | 8 | 195 | 1073314 | 609.8 | 7149 | 6931 | 1748.7 |
| D | 2 | 152 | 1043675 | 592.85 | 7149 | 6931 | 1748.7 |
| D | 13 | 137 | 532460 | 300.52 | 7149 | 6931 | 1748.7 |
Histogram calculated using DETX and DETY for each event in the final _common_clean file
| Quadrant A |  |
 |
Quadrant B |
|---|---|---|---|
| Quadrant D |  |
 |
Quadrant C |
| Plot type | Count rate plots | Images |
|---|---|---|
| Comparison with Poisson distribution Blue bars denote a histogram of data divided into 1 sec bins. Red curve is a Poisson curve with rate = median count rate of data. |
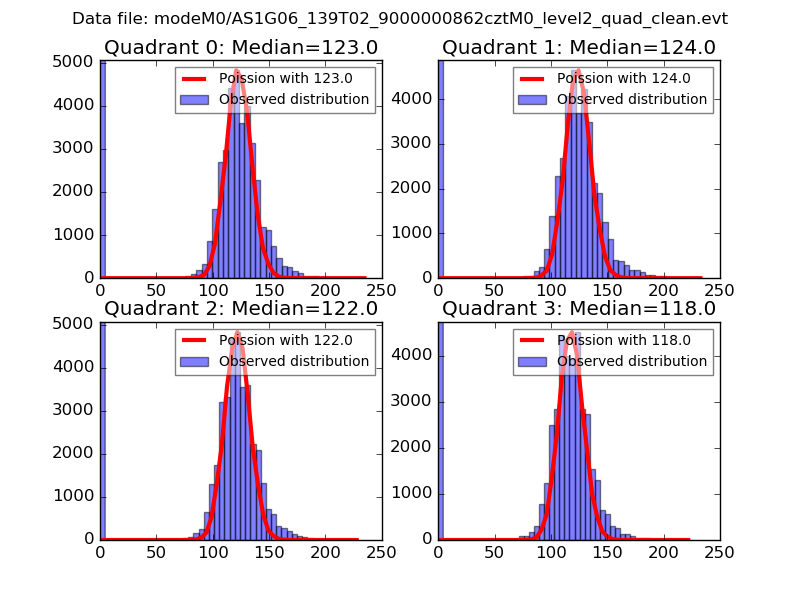 |
 |
| Quadrant-wise count rates Data is divided into 100 sec bins |
 |
|
| Module-wise count rates for Quadrant A Data is divided into 100 sec bins |
 |
 |
| Module-wise count rates for Quadrant B Data is divided into 100 sec bins |
 |
 |
| Module-wise count rates for Quadrant C Data is divided into 100 sec bins |
 |
 |
| Module-wise count rates for Quadrant D Data is divided into 100 sec bins |
 |
 |
| Parameter | Plot |
|---|---|
| CZT HV Monitor |  |
| D_VDD |  |
| Temperature 1 |  |
| Veto HV Monitor |  |
| Veto LLD |  |
| Alpha Counter |  |
| _CPM_Rate | 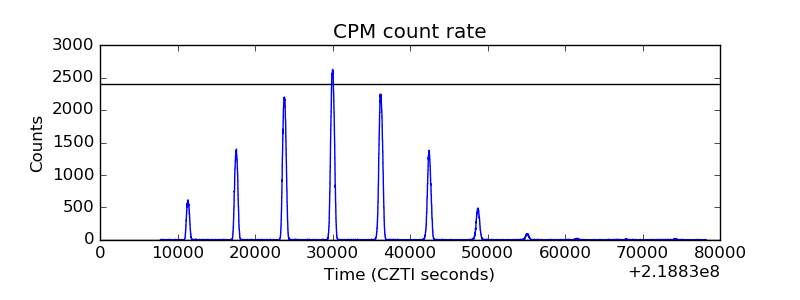 |
| CZT Counter |  |
| +2.5 Volts monitor |  |
| +5 Volts monitor | 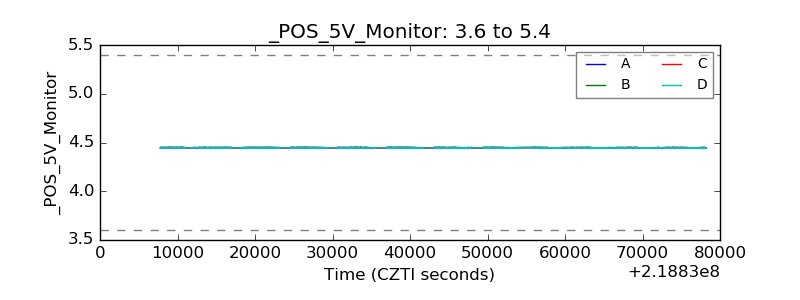 |
| _ROLL_ROT |  |
| _Roll_DEC |  |
| _Roll_RA |  |
| Veto Counter |  |