| Param | Original file | Final file |
|---|---|---|
| Filename | modeM0/AS1C02_010T01_9000000860cztM0_level2.evt | modeM0/AS1C02_010T01_9000000860cztM0_level2_quad_clean.evt |
| Size (bytes) | 455,011,200 | 104,244,480 |
| Size | 433.9 MB | 99.4 MB |
| Events in quadrant A | 3,251,893 | 674,969 |
| Events in quadrant B | 3,207,601 | 681,510 |
| Events in quadrant C | 3,016,848 | 669,900 |
| Events in quadrant D | 3,831,563 | 647,053 |
| Mode M9 | |||
|---|---|---|---|
| Quadrant | BADHDUFLAG | Total packets | Discarded packets |
| A | 0 | 8 | 0 |
| B | 0 | 8 | 0 |
| C | 0 | 8 | 0 |
| D | 0 | 8 | 0 |
| Mode SS | |||
|---|---|---|---|
| Quadrant | BADHDUFLAG | Total packets | Discarded packets |
| A | 0 | 140 | 0 |
| B | 0 | 140 | 0 |
| C | 0 | 140 | 0 |
| D | 0 | 140 | 0 |
| Mode M0 | |||
|---|---|---|---|
| Quadrant | BADHDUFLAG | Total packets | Discarded packets |
| A | 0 | 14649 | 0 |
| B | 0 | 14354 | 0 |
| C | 0 | 14033 | 0 |
| D | 0 | 16091 | 0 |
| Quadrant | Total seconds | Saturated seconds | Saturation percentage |
|---|---|---|---|
| A | 6947 | 23 | 0.331078% |
| B | 6947 | 36 | 0.518209% |
| C | 6947 | 22 | 0.316683% |
| D | 6947 | 107 | 1.540233% |
Noise dominated data is calculated using 1-second bins in cleaned event files. If a bin has >2000 counts, and if more than 50% of those come from <1% of pixels, then it is considered to be noise-dominated and hence unusable.
| Quadrant | # 1 sec bins | Bins with >0 counts | Bins with >2000 counts | High rate bins dominated by noise | Noise dominated (total time) | Noise dominated (detector-on time) | Marked lightcurve |
|---|---|---|---|---|---|---|---|
| A | 7687 | 6948 | 0 | 0 | 0.00% | 0.00% |  |
| B | 7687 | 6948 | 0 | 0 | 0.00% | 0.00% |  |
| C | 7687 | 6948 | 1 | 1 | 0.01% | 0.01% |  |
| D | 7687 | 6948 | 62 | 62 | 0.81% | 0.89% | 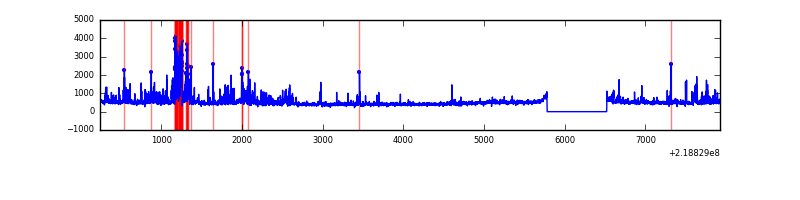 |
Top three noisy pixels from each quadrant. If the there are fewer than three noisy pixels in the level2.evt file, extra rows are filled as -1
| Pixel properties | Quadrant properties | ||||||
|---|---|---|---|---|---|---|---|
| Quadrant | DetID | PixID | Counts | Sigma | Mean | Median | Sigma |
| A | 15 | 236 | 173254 | 1069.85 | 787 | 769 | 161.2 |
| A | 8 | 15 | 32259 | 195.32 | 787 | 769 | 161.2 |
| A | 10 | 133 | 9628 | 54.95 | 787 | 769 | 161.2 |
| B | 15 | 204 | 30282 | 194.39 | 795 | 775 | 151.8 |
| B | 4 | 81 | 26614 | 170.23 | 795 | 775 | 151.8 |
| B | 0 | 214 | 18879 | 119.27 | 795 | 775 | 151.8 |
| C | 12 | 4 | 8632 | 44.26 | 768 | 769 | 177.6 |
| C | 13 | 61 | 6046 | 29.71 | 768 | 769 | 177.6 |
| C | 1 | 16 | 6035 | 29.64 | 768 | 769 | 177.6 |
| D | 2 | 152 | 603871 | 3255.68 | 765 | 741 | 185.3 |
| D | 11 | 241 | 102817 | 551.0 | 765 | 741 | 185.3 |
| D | 8 | 195 | 63888 | 340.86 | 765 | 741 | 185.3 |
Histogram calculated using DETX and DETY for each event in the final _common_clean file
| Quadrant A | 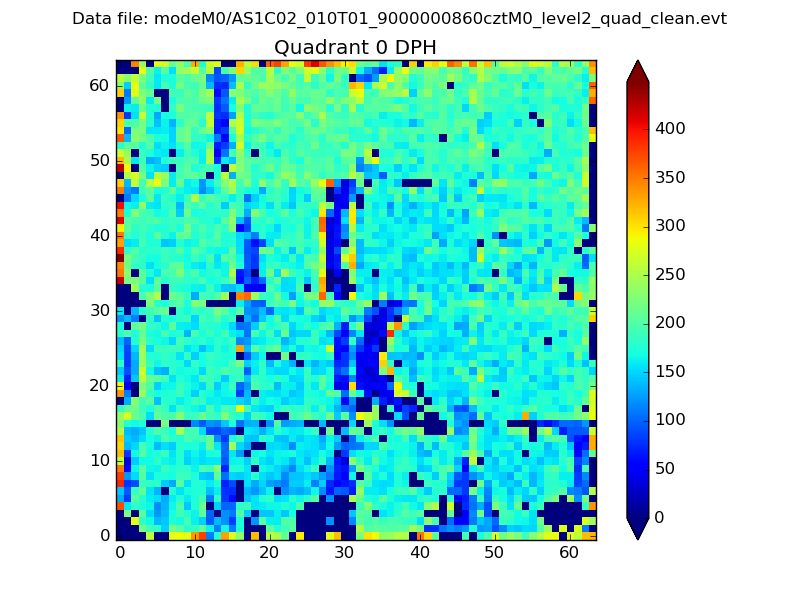 |
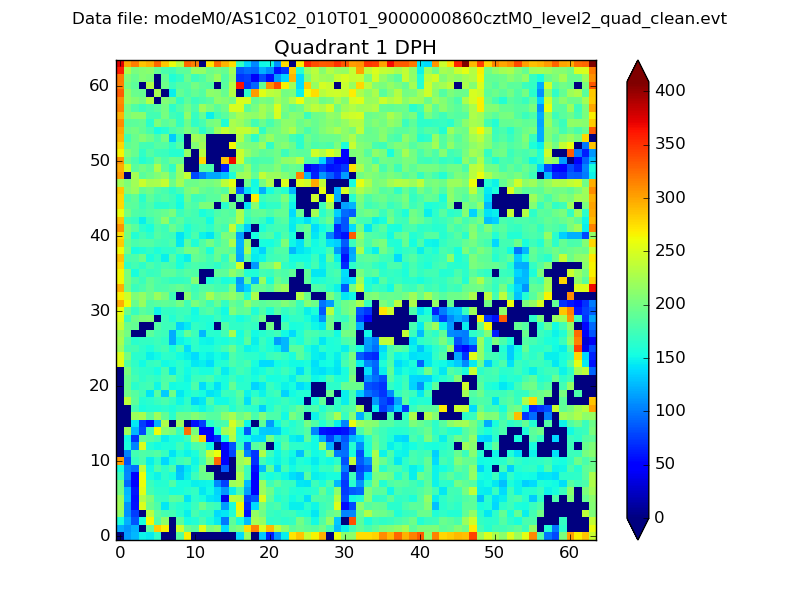 |
Quadrant B |
|---|---|---|---|
| Quadrant D |  |
 |
Quadrant C |
| Plot type | Count rate plots | Images |
|---|---|---|
| Comparison with Poisson distribution Blue bars denote a histogram of data divided into 1 sec bins. Red curve is a Poisson curve with rate = median count rate of data. |
 |
 |
| Quadrant-wise count rates Data is divided into 100 sec bins |
 |
|
| Module-wise count rates for Quadrant A Data is divided into 100 sec bins |
 |
 |
| Module-wise count rates for Quadrant B Data is divided into 100 sec bins |
 |
 |
| Module-wise count rates for Quadrant C Data is divided into 100 sec bins |
 |
 |
| Module-wise count rates for Quadrant D Data is divided into 100 sec bins |
 |
 |
| Parameter | Plot |
|---|---|
| CZT HV Monitor |  |
| D_VDD |  |
| Temperature 1 |  |
| Veto HV Monitor |  |
| Veto LLD | 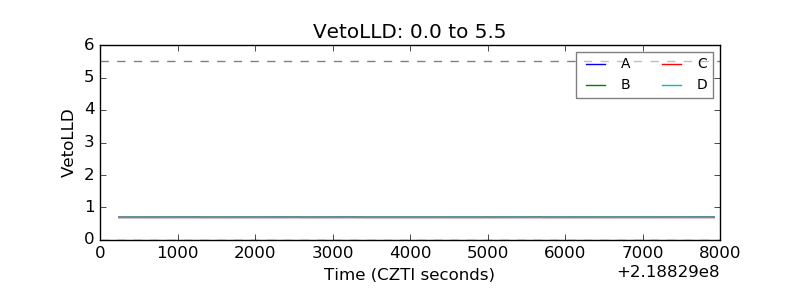 |
| Alpha Counter |  |
| _CPM_Rate |  |
| CZT Counter |  |
| +2.5 Volts monitor |  |
| +5 Volts monitor |  |
| _ROLL_ROT | 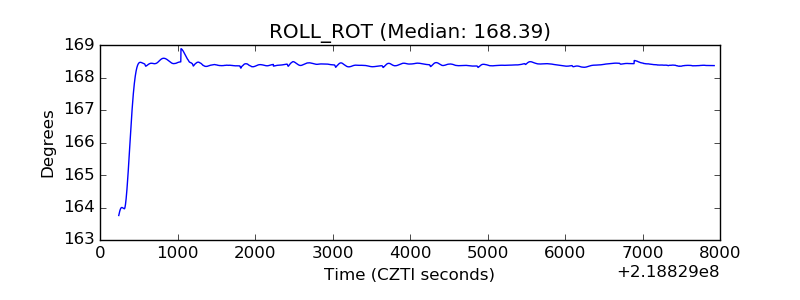 |
| _Roll_DEC | 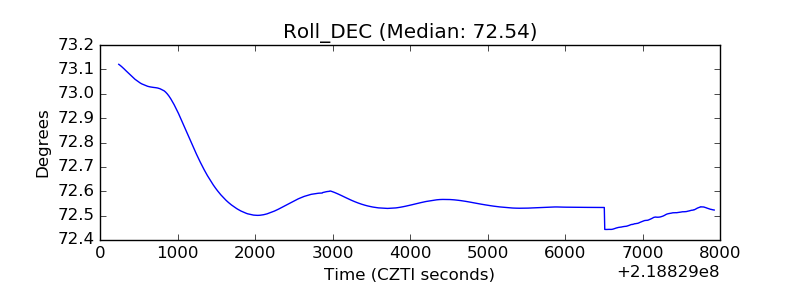 |
| _Roll_RA |  |
| Veto Counter | 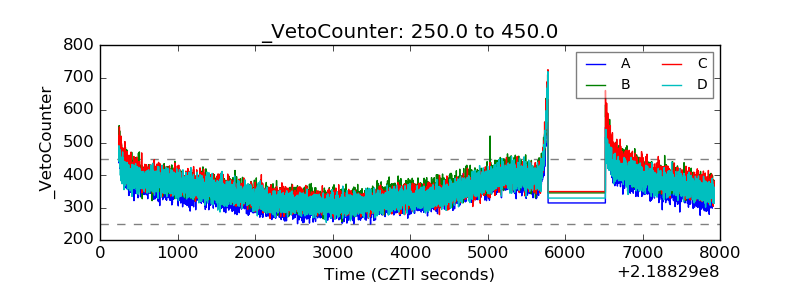 |