| Param | Original file | Final file |
|---|---|---|
| Filename | modeM0/AS1A02_058T03_9000000856cztM0_level2.evt | modeM0/AS1A02_058T03_9000000856cztM0_level2_quad_clean.evt |
| Size (bytes) | 610,758,720 | 115,295,040 |
| Size | 582.5 MB | 110.0 MB |
| Events in quadrant A | 4,492,856 | 714,489 |
| Events in quadrant B | 4,574,570 | 722,177 |
| Events in quadrant C | 4,284,827 | 703,516 |
| Events in quadrant D | 4,488,943 | 681,903 |
| Mode SS | |||
|---|---|---|---|
| Quadrant | BADHDUFLAG | Total packets | Discarded packets |
| A | 0 | 196 | 0 |
| B | 0 | 196 | 0 |
| C | 0 | 196 | 0 |
| D | 0 | 196 | 0 |
| Mode M0 | |||
|---|---|---|---|
| Quadrant | BADHDUFLAG | Total packets | Discarded packets |
| A | 0 | 20160 | 0 |
| B | 0 | 20236 | 0 |
| C | 0 | 19832 | 0 |
| D | 0 | 20432 | 0 |
| Mode M9 | |||
|---|---|---|---|
| Quadrant | BADHDUFLAG | Total packets | Discarded packets |
| A | 0 | 3 | 0 |
| B | 0 | 3 | 0 |
| C | 0 | 3 | 0 |
| D | 0 | 3 | 0 |
| Quadrant | Total seconds | Saturated seconds | Saturation percentage |
|---|---|---|---|
| A | 9658 | 157 | 1.625595% |
| B | 9658 | 180 | 1.863740% |
| C | 9658 | 63 | 0.652309% |
| D | 9658 | 67 | 0.693725% |
Noise dominated data is calculated using 1-second bins in cleaned event files. If a bin has >2000 counts, and if more than 50% of those come from <1% of pixels, then it is considered to be noise-dominated and hence unusable.
| Quadrant | # 1 sec bins | Bins with >0 counts | Bins with >2000 counts | High rate bins dominated by noise | Noise dominated (total time) | Noise dominated (detector-on time) | Marked lightcurve |
|---|---|---|---|---|---|---|---|
| A | 9703 | 9659 | 0 | 0 | 0.00% | 0.00% |  |
| B | 9703 | 9659 | 4 | 4 | 0.04% | 0.04% |  |
| C | 9703 | 9659 | 0 | 0 | 0.00% | 0.00% |  |
| D | 9703 | 9659 | 3 | 3 | 0.03% | 0.03% |  |
Top three noisy pixels from each quadrant. If the there are fewer than three noisy pixels in the level2.evt file, extra rows are filled as -1
| Pixel properties | Quadrant properties | ||||||
|---|---|---|---|---|---|---|---|
| Quadrant | DetID | PixID | Counts | Sigma | Mean | Median | Sigma |
| A | 15 | 239 | 181071 | 790.91 | 1110 | 1085 | 227.6 |
| A | 15 | 236 | 32169 | 136.59 | 1110 | 1085 | 227.6 |
| A | 0 | 226 | 10609 | 41.85 | 1110 | 1085 | 227.6 |
| B | 15 | 204 | 113835 | 524.03 | 1122 | 1093 | 215.1 |
| B | 0 | 229 | 65297 | 298.42 | 1122 | 1093 | 215.1 |
| B | 0 | 219 | 29220 | 130.74 | 1122 | 1093 | 215.1 |
| C | 8 | 128 | 15742 | 58.05 | 1088 | 1091 | 252.4 |
| C | 13 | 61 | 8545 | 29.53 | 1088 | 1091 | 252.4 |
| C | 8 | 112 | 7392 | 24.96 | 1088 | 1091 | 252.4 |
| D | 13 | 105 | 126525 | 472.5 | 1084 | 1046 | 265.6 |
| D | 5 | 97 | 68124 | 252.59 | 1084 | 1046 | 265.6 |
| D | 8 | 195 | 57450 | 212.39 | 1084 | 1046 | 265.6 |
Histogram calculated using DETX and DETY for each event in the final _common_clean file
| Quadrant A |  |
 |
Quadrant B |
|---|---|---|---|
| Quadrant D |  |
 |
Quadrant C |
| Plot type | Count rate plots | Images |
|---|---|---|
| Comparison with Poisson distribution Blue bars denote a histogram of data divided into 1 sec bins. Red curve is a Poisson curve with rate = median count rate of data. |
 |
 |
| Quadrant-wise count rates Data is divided into 100 sec bins |
 |
|
| Module-wise count rates for Quadrant A Data is divided into 100 sec bins |
 |
 |
| Module-wise count rates for Quadrant B Data is divided into 100 sec bins |
 |
 |
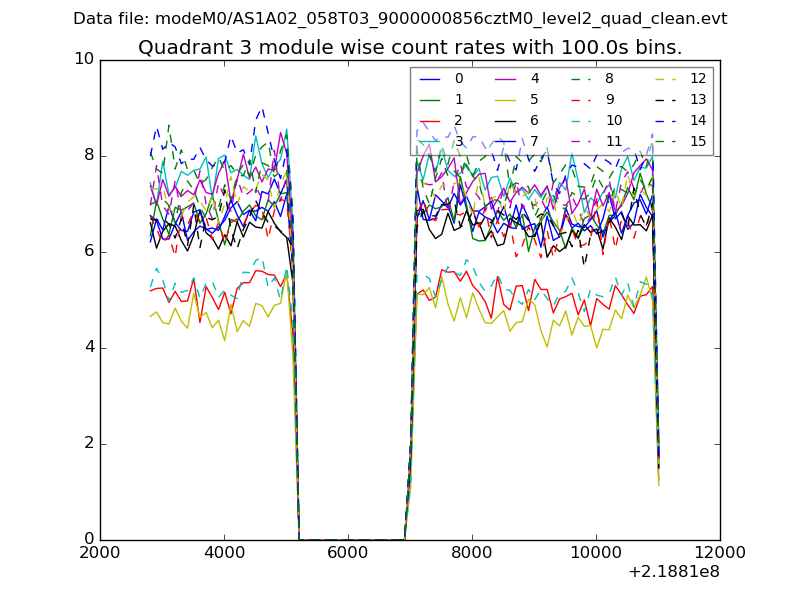
| Module-wise count rates for Quadrant C Data is divided into 100 sec bins |
 |
 |
| Module-wise count rates for Quadrant D Data is divided into 100 sec bins |
 |
 |
| Parameter | Plot |
|---|---|
| CZT HV Monitor |  |
| D_VDD |  |
| Temperature 1 |  |
| Veto HV Monitor |  |
| Veto LLD |  |
| Alpha Counter |  |
| _CPM_Rate |  |
| CZT Counter |  |
| +2.5 Volts monitor | 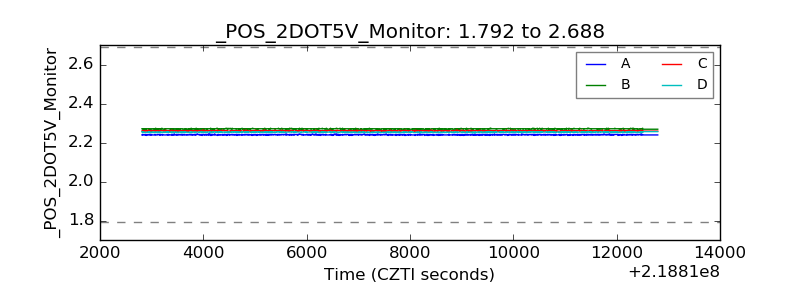 |
| +5 Volts monitor |  |
| _ROLL_ROT |  |
| _Roll_DEC |  |
| _Roll_RA |  |
| Veto Counter |  |