| Param | Original file | Final file |
|---|---|---|
| Filename | modeM0/AS1A02_191T01_9000000854cztM0_level2.evt | modeM0/AS1A02_191T01_9000000854cztM0_level2_quad_clean.evt |
| Size (bytes) | 8,125,344,000 | 1,640,393,280 |
| Size | 7.6 GB | 1.5 GB |
| Events in quadrant A | 55,304,376 | 10,482,721 |
| Events in quadrant B | 58,272,601 | 10,775,655 |
| Events in quadrant C | 53,523,135 | 10,355,710 |
| Events in quadrant D | 70,793,711 | 9,764,879 |
| Mode M0 | |||
|---|---|---|---|
| Quadrant | BADHDUFLAG | Total packets | Discarded packets |
| A | 0 | 248753 | 0 |
| B | 0 | 255094 | 0 |
| C | 0 | 247353 | 0 |
| D | 0 | 295443 | 0 |
| Mode SS | |||
|---|---|---|---|
| Quadrant | BADHDUFLAG | Total packets | Discarded packets |
| A | 0 | 2464 | 0 |
| B | 0 | 2464 | 0 |
| C | 0 | 2464 | 0 |
| D | 0 | 2464 | 0 |
| Mode M9 | |||
|---|---|---|---|
| Quadrant | BADHDUFLAG | Total packets | Discarded packets |
| A | 0 | 208 | 0 |
| B | 0 | 208 | 0 |
| C | 0 | 208 | 0 |
| D | 0 | 208 | 0 |
| Quadrant | Total seconds | Saturated seconds | Saturation percentage |
|---|---|---|---|
| A | 121280 | 1243 | 1.024901% |
| B | 121280 | 1436 | 1.184037% |
| C | 121280 | 721 | 0.594492% |
| D | 121280 | 3492 | 2.879288% |
Noise dominated data is calculated using 1-second bins in cleaned event files. If a bin has >2000 counts, and if more than 50% of those come from <1% of pixels, then it is considered to be noise-dominated and hence unusable.
| Quadrant | # 1 sec bins | Bins with >0 counts | Bins with >2000 counts | High rate bins dominated by noise | Noise dominated (total time) | Noise dominated (detector-on time) | Marked lightcurve |
|---|---|---|---|---|---|---|---|
| A | 141770 | 121303 | 3 | 3 | 0.00% | 0.00% |  |
| B | 141770 | 121303 | 125 | 125 | 0.09% | 0.10% |  |
| C | 141770 | 121303 | 1 | 1 | 0.00% | 0.00% | 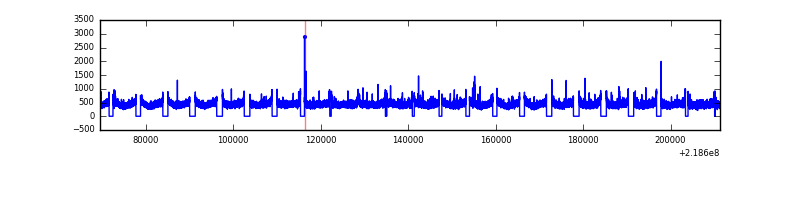 |
| D | 141770 | 121303 | 2045 | 2045 | 1.44% | 1.69% |  |
Top three noisy pixels from each quadrant. If the there are fewer than three noisy pixels in the level2.evt file, extra rows are filled as -1
| Pixel properties | Quadrant properties | ||||||
|---|---|---|---|---|---|---|---|
| Quadrant | DetID | PixID | Counts | Sigma | Mean | Median | Sigma |
| A | 8 | 15 | 233665 | 77.54 | 14146 | 13839 | 2834.9 |
| A | 15 | 234 | 203642 | 66.95 | 14146 | 13839 | 2834.9 |
| A | 15 | 239 | 144500 | 46.09 | 14146 | 13839 | 2834.9 |
| B | 0 | 228 | 1178606 | 432.58 | 14263 | 13929 | 2692.4 |
| B | 15 | 204 | 457586 | 164.78 | 14263 | 13929 | 2692.4 |
| B | 11 | 51 | 380680 | 136.22 | 14263 | 13929 | 2692.4 |
| C | 1 | 16 | 154275 | 45.08 | 13633 | 13663 | 3119.0 |
| C | 13 | 61 | 108008 | 30.25 | 13633 | 13663 | 3119.0 |
| C | 10 | 170 | 61137 | 15.22 | 13633 | 13663 | 3119.0 |
| D | 2 | 63 | 12518683 | 3776.57 | 13551 | 13116 | 3311.4 |
| D | 2 | 152 | 2632545 | 791.04 | 13551 | 13116 | 3311.4 |
| D | 2 | 136 | 834326 | 248.0 | 13551 | 13116 | 3311.4 |
Histogram calculated using DETX and DETY for each event in the final _common_clean file
| Quadrant A |  |
 |
Quadrant B |
|---|---|---|---|
| Quadrant D |  |
 |
Quadrant C |
| Plot type | Count rate plots | Images |
|---|---|---|
| Comparison with Poisson distribution Blue bars denote a histogram of data divided into 1 sec bins. Red curve is a Poisson curve with rate = median count rate of data. |
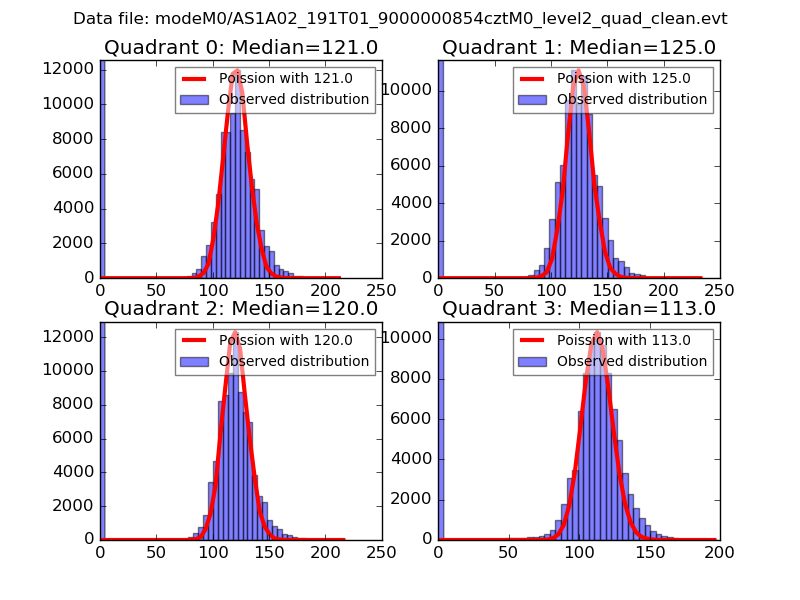 |
 |
| Quadrant-wise count rates Data is divided into 100 sec bins |
 |
|
| Module-wise count rates for Quadrant A Data is divided into 100 sec bins |
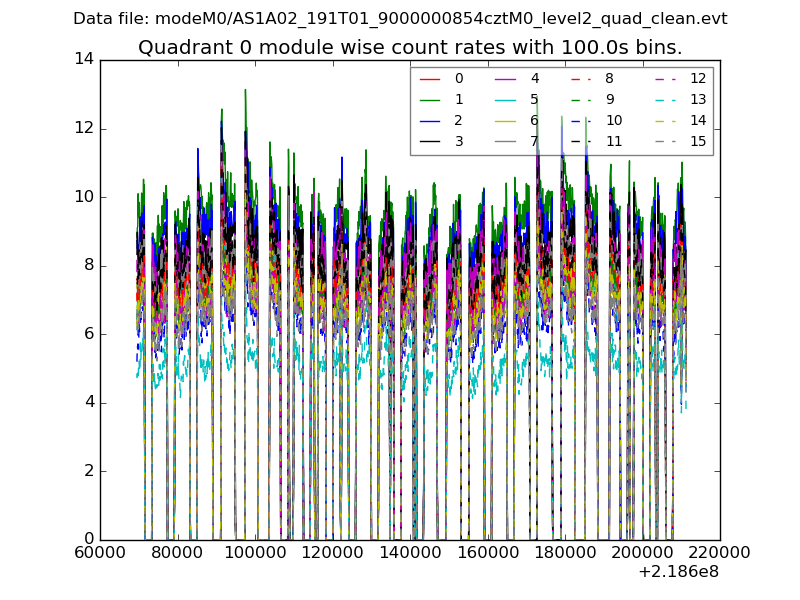 |
 |
| Module-wise count rates for Quadrant B Data is divided into 100 sec bins |
 |
 |
| Module-wise count rates for Quadrant C Data is divided into 100 sec bins |
 |
 |
| Module-wise count rates for Quadrant D Data is divided into 100 sec bins |
 |
 |
| Parameter | Plot |
|---|---|
| CZT HV Monitor | 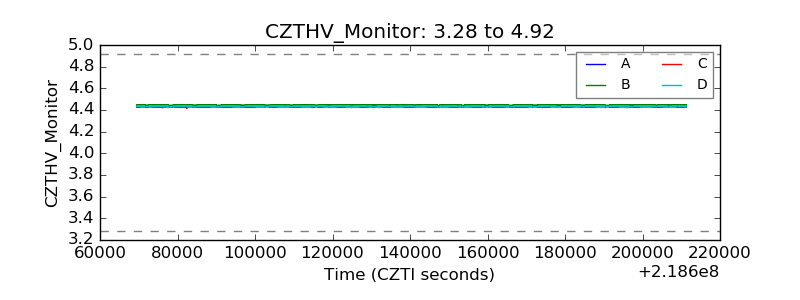 |
| D_VDD |  |
| Temperature 1 |  |
| Veto HV Monitor |  |
| Veto LLD |  |
| Alpha Counter |  |
| _CPM_Rate |  |
| CZT Counter |  |
| +2.5 Volts monitor |  |
| +5 Volts monitor |  |
| _ROLL_ROT | 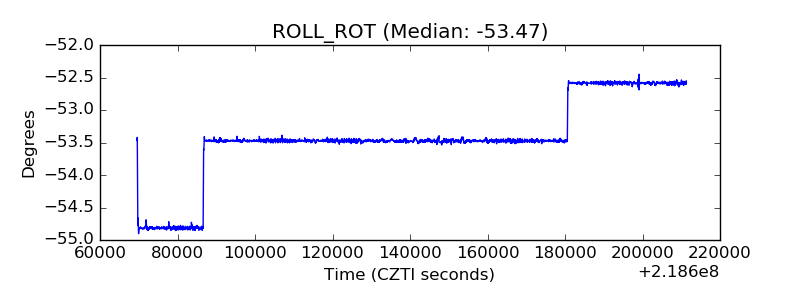 |
| _Roll_DEC |  |
| _Roll_RA | 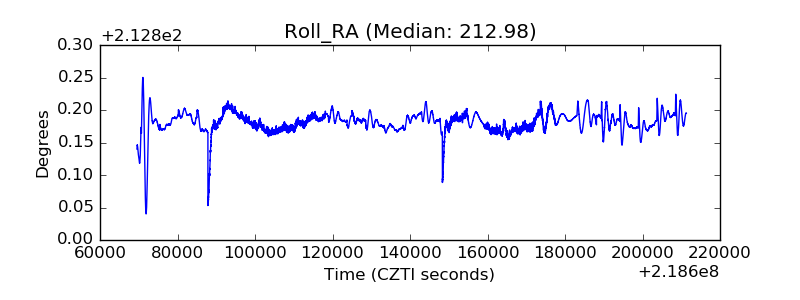 |
| Veto Counter |  |