| Param | Original file | Final file |
|---|---|---|
| Filename | modeM0/AS1C02_011T01_9000000850cztM0_level2.evt | modeM0/AS1C02_011T01_9000000850cztM0_level2_quad_clean.evt |
| Size (bytes) | 8,024,414,400 | 1,333,958,400 |
| Size | 7.5 GB | 1.2 GB |
| Events in quadrant A | 55,979,536 | 8,284,088 |
| Events in quadrant B | 56,247,576 | 8,403,524 |
| Events in quadrant C | 52,812,237 | 8,382,061 |
| Events in quadrant D | 70,537,979 | 7,768,665 |
| Mode SS | |||
|---|---|---|---|
| Quadrant | BADHDUFLAG | Total packets | Discarded packets |
| A | 0 | 2248 | 0 |
| B | 0 | 2248 | 0 |
| C | 0 | 2248 | 0 |
| D | 0 | 2248 | 0 |
| Mode M0 | |||
|---|---|---|---|
| Quadrant | BADHDUFLAG | Total packets | Discarded packets |
| A | 0 | 238820 | 0 |
| B | 0 | 238752 | 0 |
| C | 0 | 233098 | 0 |
| D | 0 | 283249 | 0 |
| Mode M9 | |||
|---|---|---|---|
| Quadrant | BADHDUFLAG | Total packets | Discarded packets |
| A | 0 | 145 | 0 |
| B | 0 | 145 | 0 |
| C | 0 | 145 | 0 |
| D | 0 | 145 | 0 |
| Quadrant | Total seconds | Saturated seconds | Saturation percentage |
|---|---|---|---|
| A | 110364 | 2019 | 1.829401% |
| B | 110364 | 2423 | 2.195462% |
| C | 110364 | 1078 | 0.976768% |
| D | 110364 | 6497 | 5.886883% |
Noise dominated data is calculated using 1-second bins in cleaned event files. If a bin has >2000 counts, and if more than 50% of those come from <1% of pixels, then it is considered to be noise-dominated and hence unusable.
| Quadrant | # 1 sec bins | Bins with >0 counts | Bins with >2000 counts | High rate bins dominated by noise | Noise dominated (total time) | Noise dominated (detector-on time) | Marked lightcurve |
|---|---|---|---|---|---|---|---|
| A | 124021 | 110387 | 275 | 275 | 0.22% | 0.25% |  |
| B | 124021 | 110387 | 365 | 365 | 0.29% | 0.33% | 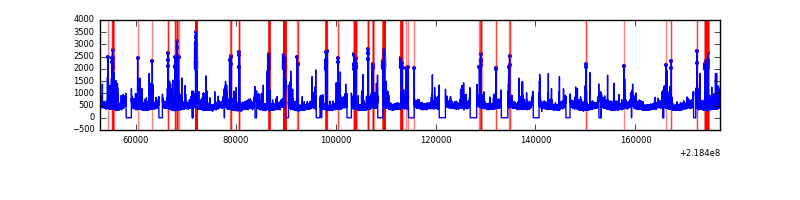 |
| C | 124021 | 110387 | 245 | 245 | 0.20% | 0.22% |  |
| D | 124021 | 110387 | 5174 | 5174 | 4.17% | 4.69% |  |
Top three noisy pixels from each quadrant. If the there are fewer than three noisy pixels in the level2.evt file, extra rows are filled as -1
| Pixel properties | Quadrant properties | ||||||
|---|---|---|---|---|---|---|---|
| Quadrant | DetID | PixID | Counts | Sigma | Mean | Median | Sigma |
| A | 13 | 251 | 2005509 | 741.8 | 13305 | 13020 | 2686.0 |
| A | 8 | 15 | 1282515 | 472.63 | 13305 | 13020 | 2686.0 |
| A | 15 | 236 | 929692 | 341.28 | 13305 | 13020 | 2686.0 |
| B | 0 | 228 | 1331224 | 514.6 | 13413 | 13111 | 2561.4 |
| B | 4 | 81 | 1145102 | 441.94 | 13413 | 13111 | 2561.4 |
| B | 15 | 204 | 484254 | 183.94 | 13413 | 13111 | 2561.4 |
| C | 8 | 208 | 1637464 | 544.15 | 12953 | 13042 | 2985.3 |
| C | 9 | 16 | 369664 | 119.46 | 12953 | 13042 | 2985.3 |
| C | 1 | 16 | 178030 | 55.27 | 12953 | 13042 | 2985.3 |
| D | 13 | 105 | 10115849 | 3230.79 | 12746 | 12348 | 3127.2 |
| D | 4 | 95 | 4468498 | 1424.94 | 12746 | 12348 | 3127.2 |
| D | 2 | 152 | 2389077 | 760.01 | 12746 | 12348 | 3127.2 |
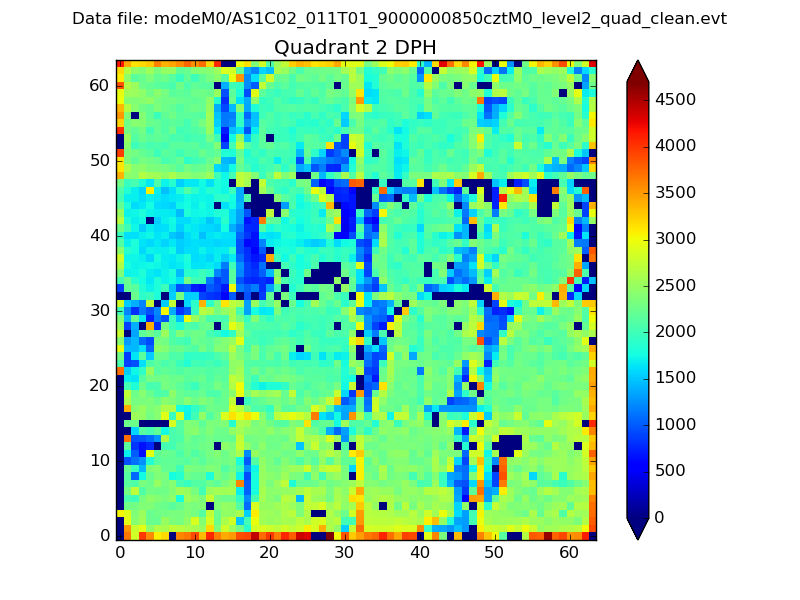
Histogram calculated using DETX and DETY for each event in the final _common_clean file
| Quadrant A |  |
 |
Quadrant B |
|---|---|---|---|
| Quadrant D |  |
 |
Quadrant C |
| Plot type | Count rate plots | Images |
|---|---|---|
| Comparison with Poisson distribution Blue bars denote a histogram of data divided into 1 sec bins. Red curve is a Poisson curve with rate = median count rate of data. |
 |
 |
| Quadrant-wise count rates Data is divided into 100 sec bins |
 |
|
| Module-wise count rates for Quadrant A Data is divided into 100 sec bins |
 |
 |
| Module-wise count rates for Quadrant B Data is divided into 100 sec bins |
 |
 |
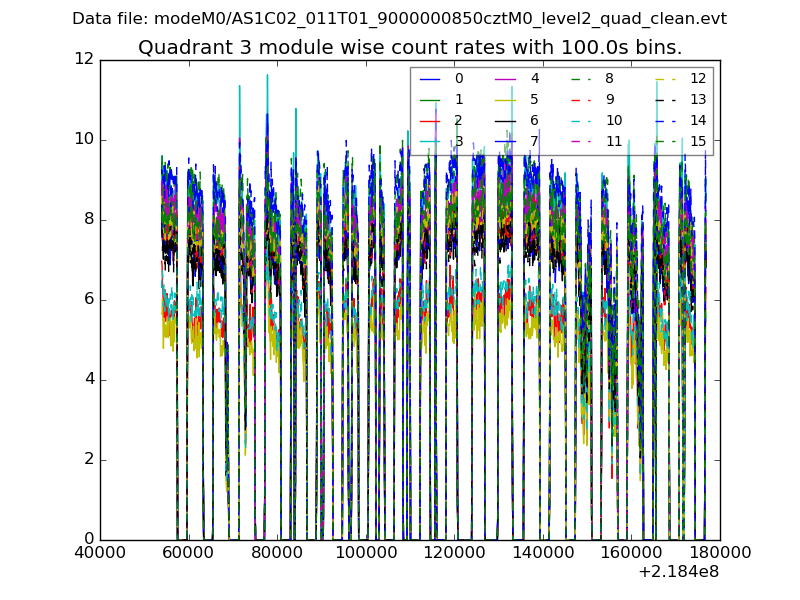
| Module-wise count rates for Quadrant C Data is divided into 100 sec bins |
 |
 |
| Module-wise count rates for Quadrant D Data is divided into 100 sec bins |
 |
 |
| Parameter | Plot |
|---|---|
| CZT HV Monitor | 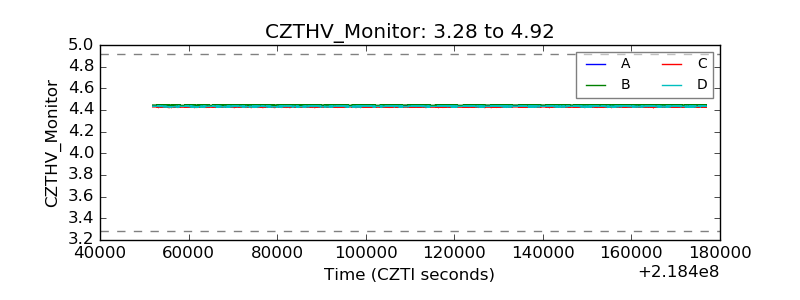 |
| D_VDD |  |
| Temperature 1 |  |
| Veto HV Monitor |  |
| Veto LLD |  |
| Alpha Counter |  |
| _CPM_Rate |  |
| CZT Counter |  |
| +2.5 Volts monitor |  |
| +5 Volts monitor |  |
| _ROLL_ROT |  |
| _Roll_DEC | 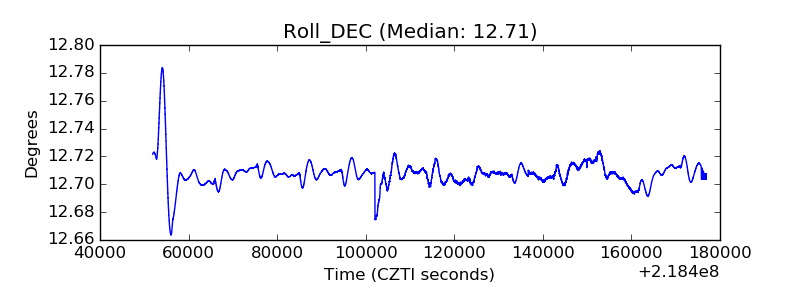 |
| _Roll_RA |  |
| Veto Counter |  |