| Param | Original file | Final file |
|---|---|---|
| Filename | modeM0/AS1G06_169T01_9000000846cztM0_level2.evt | modeM0/AS1G06_169T01_9000000846cztM0_level2_quad_clean.evt |
| Size (bytes) | 785,139,840 | 128,128,320 |
| Size | 748.8 MB | 122.2 MB |
| Events in quadrant A | 6,763,855 | 793,638 |
| Events in quadrant B | 5,584,276 | 794,772 |
| Events in quadrant C | 4,822,002 | 785,322 |
| Events in quadrant D | 5,883,766 | 767,061 |
| Mode M0 | |||
|---|---|---|---|
| Quadrant | BADHDUFLAG | Total packets | Discarded packets |
| A | 0 | 27510 | 0 |
| B | 0 | 23882 | 0 |
| C | 0 | 22070 | 0 |
| D | 0 | 24965 | 0 |
| Mode M9 | |||
|---|---|---|---|
| Quadrant | BADHDUFLAG | Total packets | Discarded packets |
| A | 0 | 4 | 0 |
| B | 0 | 4 | 0 |
| C | 0 | 4 | 0 |
| D | 0 | 4 | 0 |
| Mode SS | |||
|---|---|---|---|
| Quadrant | BADHDUFLAG | Total packets | Discarded packets |
| A | 0 | 220 | 0 |
| B | 0 | 220 | 0 |
| C | 0 | 218 | 0 |
| D | 0 | 220 | 0 |
| Quadrant | Total seconds | Saturated seconds | Saturation percentage |
|---|---|---|---|
| A | 10659 | 842 | 7.899428% |
| B | 10675 | 316 | 2.960187% |
| C | 10691 | 161 | 1.505940% |
| D | 10677 | 313 | 2.931535% |
Noise dominated data is calculated using 1-second bins in cleaned event files. If a bin has >2000 counts, and if more than 50% of those come from <1% of pixels, then it is considered to be noise-dominated and hence unusable.
| Quadrant | # 1 sec bins | Bins with >0 counts | Bins with >2000 counts | High rate bins dominated by noise | Noise dominated (total time) | Noise dominated (detector-on time) | Marked lightcurve |
|---|---|---|---|---|---|---|---|
| A | 11218 | 10791 | 294 | 294 | 2.62% | 2.72% |  |
| B | 11218 | 10795 | 23 | 23 | 0.21% | 0.21% | 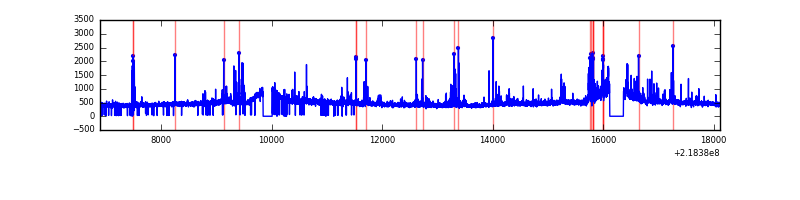 |
| C | 11218 | 10800 | 0 | 0 | 0.00% | 0.00% | 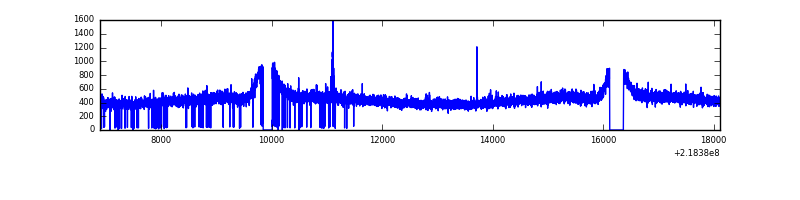 |
| D | 11217 | 10799 | 110 | 110 | 0.98% | 1.02% |  |
Top three noisy pixels from each quadrant. If the there are fewer than three noisy pixels in the level2.evt file, extra rows are filled as -1
| Pixel properties | Quadrant properties | ||||||
|---|---|---|---|---|---|---|---|
| Quadrant | DetID | PixID | Counts | Sigma | Mean | Median | Sigma |
| A | 8 | 15 | 1992447 | 8022.37 | 1221 | 1195 | 248.2 |
| A | 15 | 234 | 17459 | 65.52 | 1221 | 1195 | 248.2 |
| A | 13 | 251 | 15625 | 58.14 | 1221 | 1195 | 248.2 |
| B | 0 | 228 | 190292 | 770.24 | 1266 | 1234 | 245.5 |
| B | 4 | 81 | 132381 | 534.31 | 1266 | 1234 | 245.5 |
| B | 0 | 219 | 94928 | 381.72 | 1266 | 1234 | 245.5 |
| C | 9 | 54 | 23770 | 79.25 | 1225 | 1226 | 284.5 |
| C | 13 | 61 | 9875 | 30.4 | 1225 | 1226 | 284.5 |
| C | 4 | 254 | 6429 | 18.29 | 1225 | 1226 | 284.5 |
| D | 2 | 136 | 389648 | 1285.65 | 1230 | 1188 | 302.1 |
| D | 2 | 152 | 210229 | 691.85 | 1230 | 1188 | 302.1 |
| D | 13 | 105 | 193544 | 636.62 | 1230 | 1188 | 302.1 |
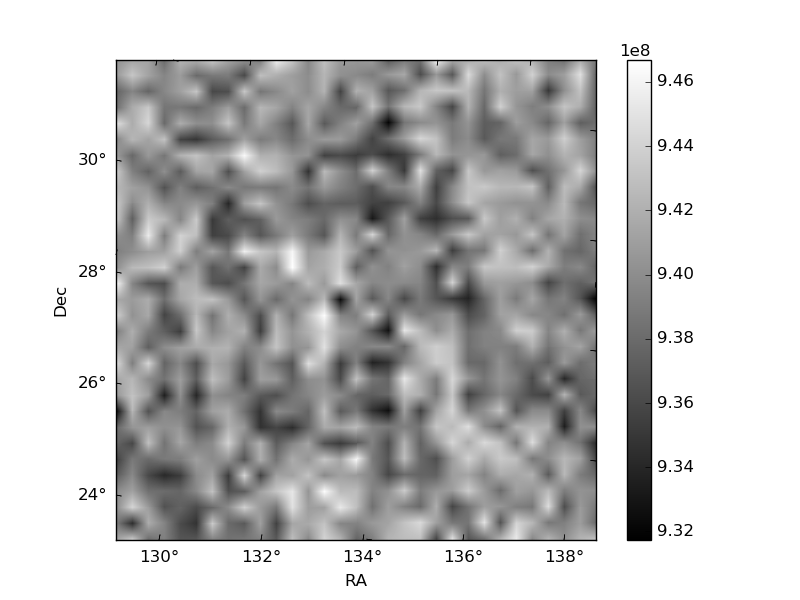
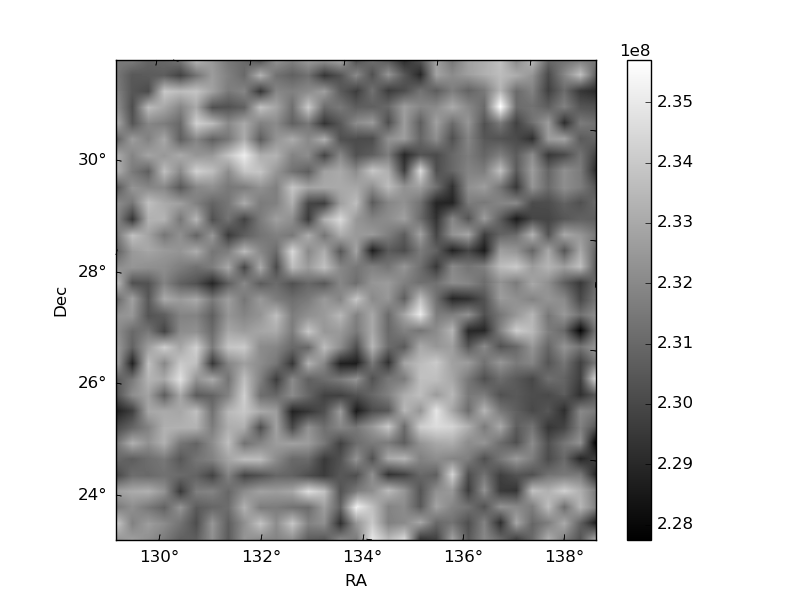
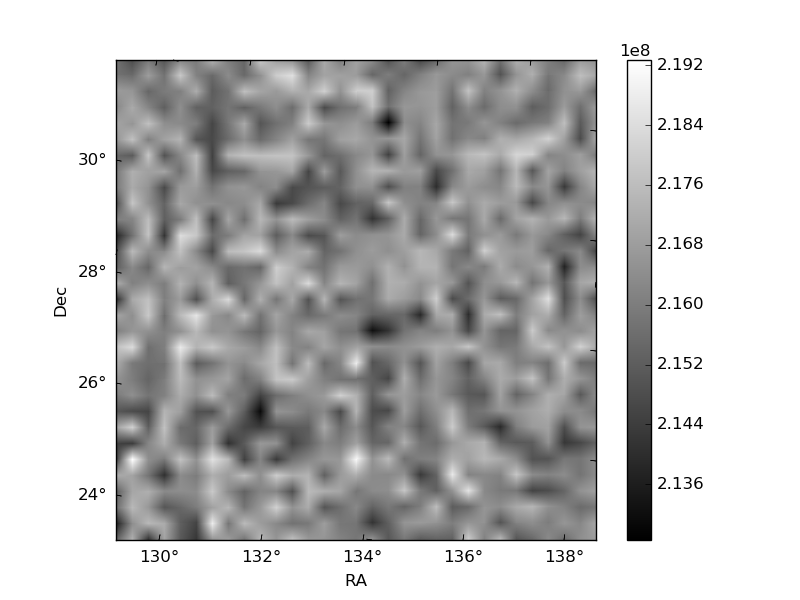
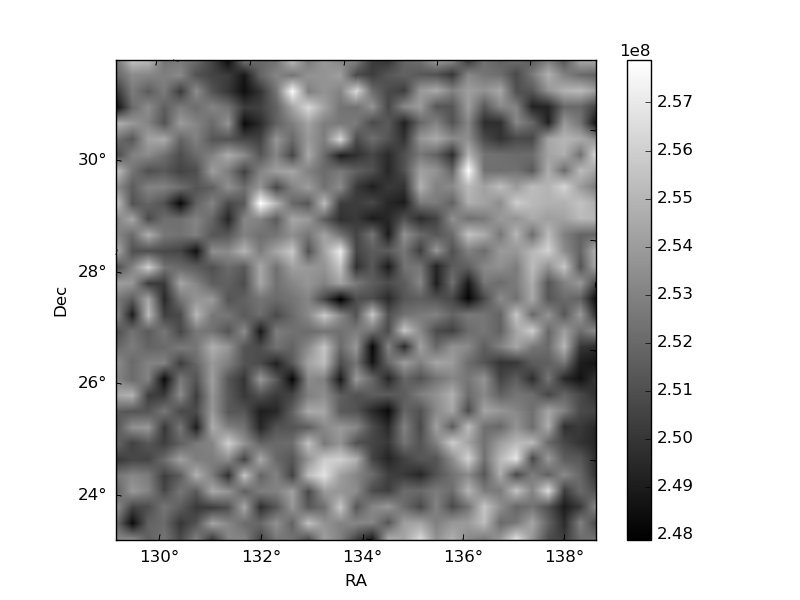
Histogram calculated using DETX and DETY for each event in the final _common_clean file
| Quadrant A |  |
 |
Quadrant B |
|---|---|---|---|
| Quadrant D |  |
 |
Quadrant C |
| Plot type | Count rate plots | Images |
|---|---|---|
| Comparison with Poisson distribution Blue bars denote a histogram of data divided into 1 sec bins. Red curve is a Poisson curve with rate = median count rate of data. |
 |
 |
| Quadrant-wise count rates Data is divided into 100 sec bins |
 |
|
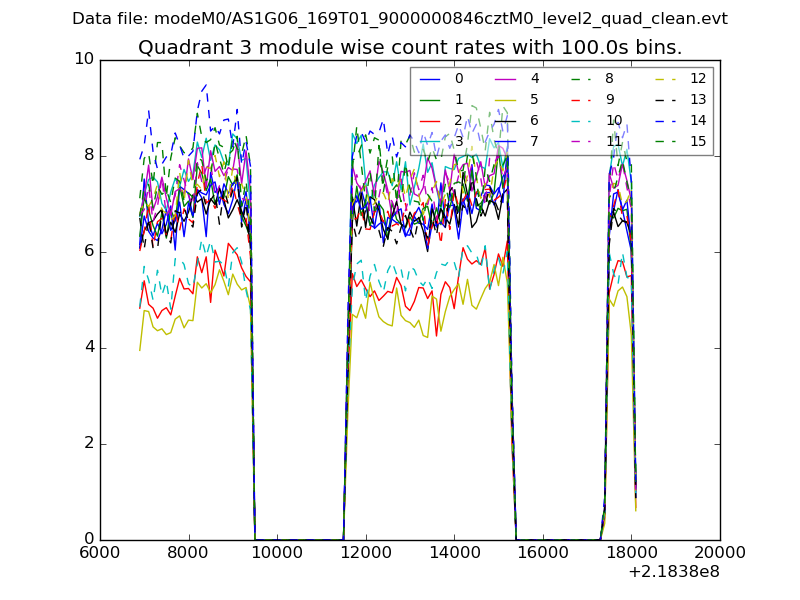
| Module-wise count rates for Quadrant A Data is divided into 100 sec bins |
 |
 |
| Module-wise count rates for Quadrant B Data is divided into 100 sec bins |
 |
 |
| Module-wise count rates for Quadrant C Data is divided into 100 sec bins |
 |
 |
| Module-wise count rates for Quadrant D Data is divided into 100 sec bins |
 |
 |
| Parameter | Plot |
|---|---|
| CZT HV Monitor |  |
| D_VDD |  |
| Temperature 1 | 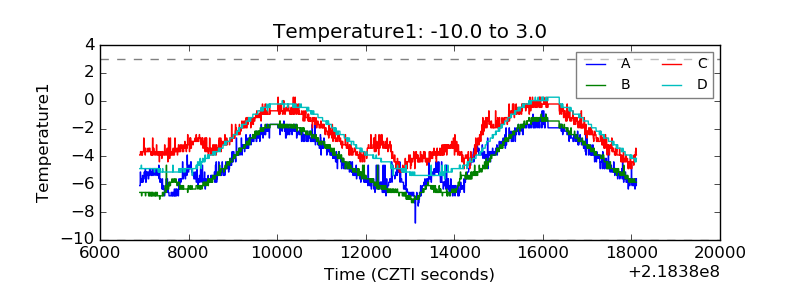 |
| Veto HV Monitor |  |
| Veto LLD | 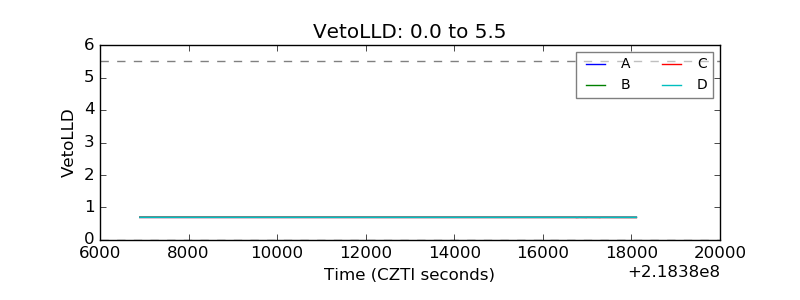 |
| Alpha Counter |  |
| _CPM_Rate | 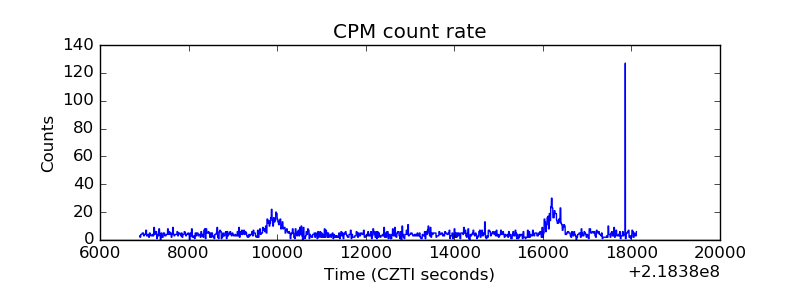 |
| CZT Counter | 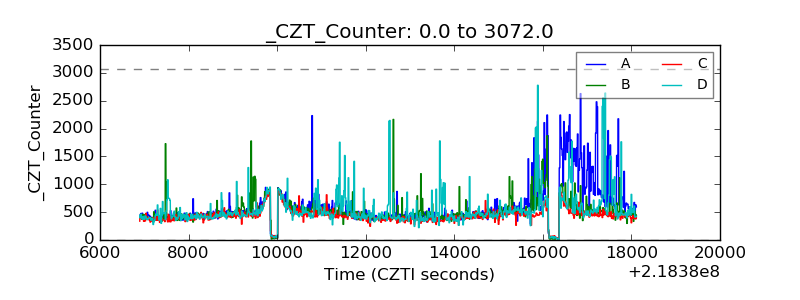 |
| +2.5 Volts monitor |  |
| +5 Volts monitor |  |
| _ROLL_ROT |  |
| _Roll_DEC |  |
| _Roll_RA | 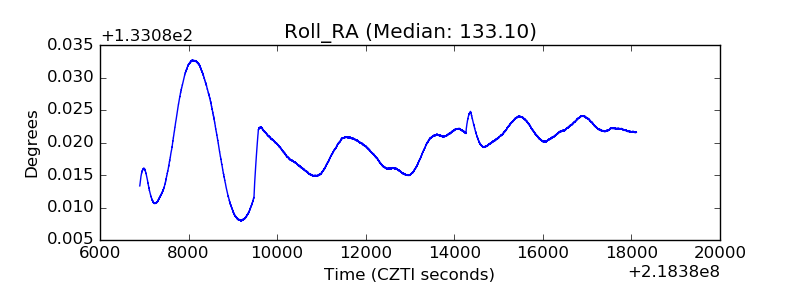 |
| Veto Counter | 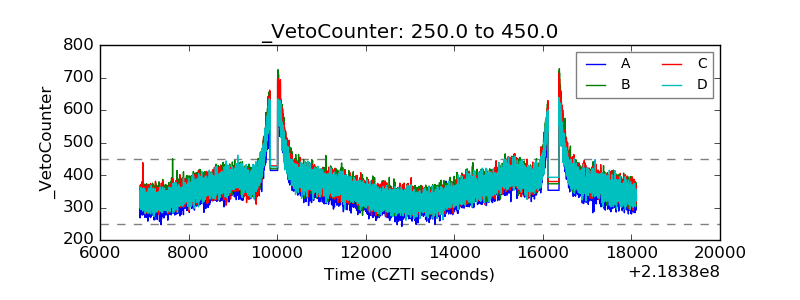 |