| Param | Original file | Final file |
|---|---|---|
| Filename | modeM0/AS1G06_164T01_9000000844cztM0_level2.evt | modeM0/AS1G06_164T01_9000000844cztM0_level2_quad_clean.evt |
| Size (bytes) | 2,812,723,200 | 590,696,640 |
| Size | 2.6 GB | 563.3 MB |
| Events in quadrant A | 23,109,606 | 3,849,165 |
| Events in quadrant B | 21,389,308 | 3,849,669 |
| Events in quadrant C | 17,745,142 | 3,787,647 |
| Events in quadrant D | 20,270,386 | 3,689,864 |
| Mode SS | |||
|---|---|---|---|
| Quadrant | BADHDUFLAG | Total packets | Discarded packets |
| A | 0 | 808 | 0 |
| B | 0 | 808 | 0 |
| C | 0 | 808 | 0 |
| D | 0 | 808 | 0 |
| Mode M9 | |||
|---|---|---|---|
| Quadrant | BADHDUFLAG | Total packets | Discarded packets |
| A | 0 | 83 | 0 |
| B | 0 | 83 | 0 |
| C | 0 | 83 | 0 |
| D | 0 | 83 | 0 |
| Mode M0 | |||
|---|---|---|---|
| Quadrant | BADHDUFLAG | Total packets | Discarded packets |
| A | 0 | 94850 | 0 |
| B | 0 | 89740 | 0 |
| C | 0 | 80982 | 0 |
| D | 0 | 87164 | 0 |
| Quadrant | Total seconds | Saturated seconds | Saturation percentage |
|---|---|---|---|
| A | 39546 | 1230 | 3.110302% |
| B | 39546 | 1061 | 2.682951% |
| C | 39546 | 403 | 1.019066% |
| D | 39546 | 622 | 1.572852% |
Noise dominated data is calculated using 1-second bins in cleaned event files. If a bin has >2000 counts, and if more than 50% of those come from <1% of pixels, then it is considered to be noise-dominated and hence unusable.
| Quadrant | # 1 sec bins | Bins with >0 counts | Bins with >2000 counts | High rate bins dominated by noise | Noise dominated (total time) | Noise dominated (detector-on time) | Marked lightcurve |
|---|---|---|---|---|---|---|---|
| A | 47926 | 39553 | 371 | 371 | 0.77% | 0.94% |  |
| B | 47926 | 39554 | 391 | 391 | 0.82% | 0.99% | 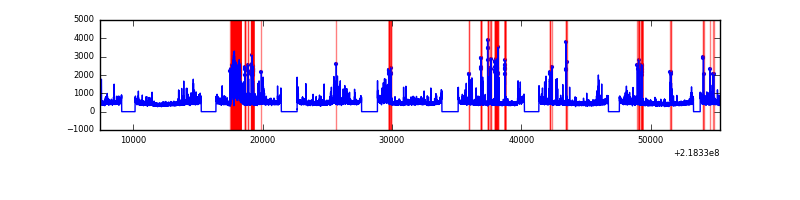 |
| C | 47926 | 39554 | 13 | 13 | 0.03% | 0.03% |  |
| D | 47926 | 39554 | 164 | 164 | 0.34% | 0.41% | 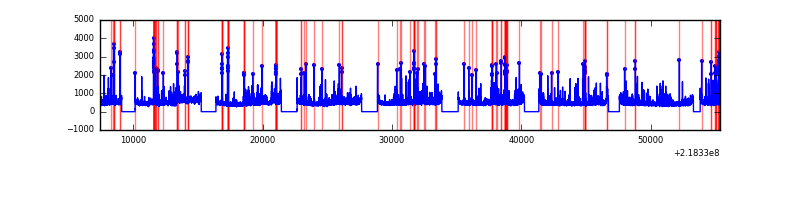 |
Top three noisy pixels from each quadrant. If the there are fewer than three noisy pixels in the level2.evt file, extra rows are filled as -1
| Pixel properties | Quadrant properties | ||||||
|---|---|---|---|---|---|---|---|
| Quadrant | DetID | PixID | Counts | Sigma | Mean | Median | Sigma |
| A | 8 | 15 | 4788039 | 5228.43 | 4613 | 4524 | 914.9 |
| A | 15 | 174 | 374033 | 403.88 | 4613 | 4524 | 914.9 |
| A | 15 | 236 | 70416 | 72.02 | 4613 | 4524 | 914.9 |
| B | 0 | 228 | 1638194 | 1905.98 | 4621 | 4514 | 857.1 |
| B | 0 | 219 | 532974 | 616.54 | 4621 | 4514 | 857.1 |
| B | 0 | 229 | 365455 | 421.1 | 4621 | 4514 | 857.1 |
| C | 4 | 254 | 168306 | 162.28 | 4449 | 4459 | 1009.6 |
| C | 9 | 54 | 95171 | 89.85 | 4449 | 4459 | 1009.6 |
| C | 1 | 241 | 57061 | 52.1 | 4449 | 4459 | 1009.6 |
| D | 2 | 152 | 801716 | 736.26 | 4492 | 4355 | 1083.0 |
| D | 12 | 221 | 770684 | 707.6 | 4492 | 4355 | 1083.0 |
| D | 5 | 97 | 517613 | 473.92 | 4492 | 4355 | 1083.0 |
Histogram calculated using DETX and DETY for each event in the final _common_clean file
| Quadrant A |  |
 |
Quadrant B |
|---|---|---|---|
| Quadrant D |  |
 |
Quadrant C |
| Plot type | Count rate plots | Images |
|---|---|---|
| Comparison with Poisson distribution Blue bars denote a histogram of data divided into 1 sec bins. Red curve is a Poisson curve with rate = median count rate of data. |
 |
 |
| Quadrant-wise count rates Data is divided into 100 sec bins |
 |
|
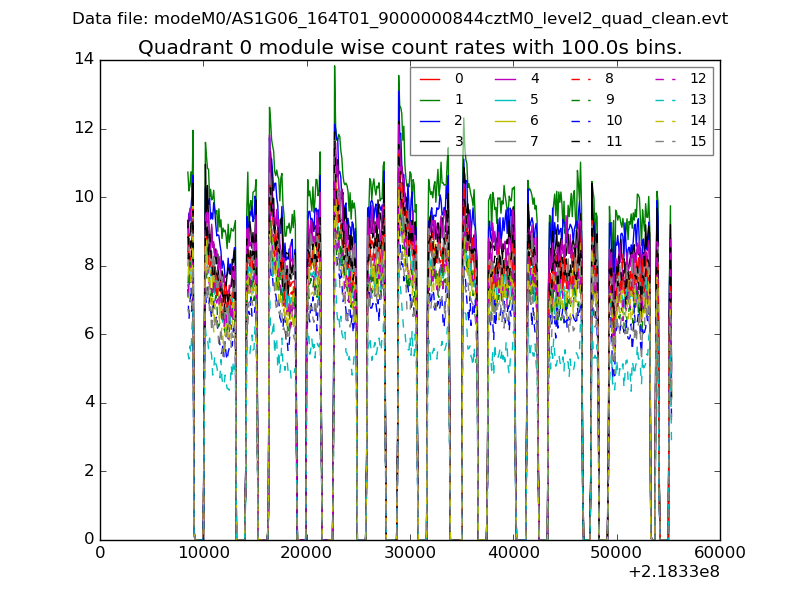
| Module-wise count rates for Quadrant A Data is divided into 100 sec bins |
 |
 |
| Module-wise count rates for Quadrant B Data is divided into 100 sec bins |
 |
 |
| Module-wise count rates for Quadrant C Data is divided into 100 sec bins |
 |
 |
| Module-wise count rates for Quadrant D Data is divided into 100 sec bins |
 |
 |
| Parameter | Plot |
|---|---|
| CZT HV Monitor |  |
| D_VDD |  |
| Temperature 1 |  |
| Veto HV Monitor | 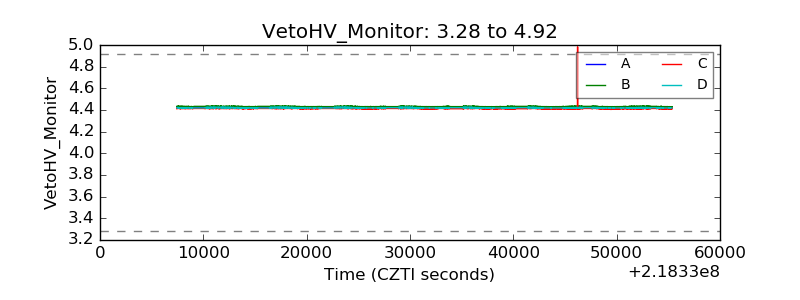 |
| Veto LLD |  |
| Alpha Counter |  |
| _CPM_Rate |  |
| CZT Counter | 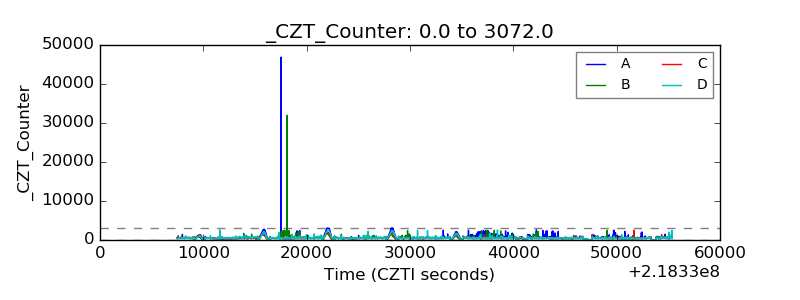 |
| +2.5 Volts monitor | 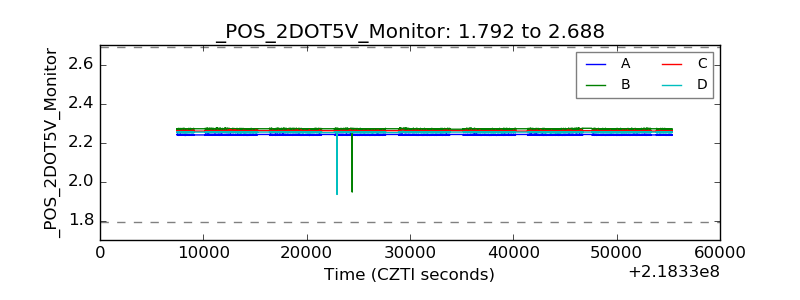 |
| +5 Volts monitor |  |
| _ROLL_ROT |  |
| _Roll_DEC |  |
| _Roll_RA |  |
| Veto Counter |  |