| Param | Original file | Final file |
|---|---|---|
| Filename | modeM0/AS1C02_017T01_9000000848cztM0_level2.evt | modeM0/AS1C02_017T01_9000000848cztM0_level2_quad_clean.evt |
| Size (bytes) | 3,140,752,320 | 807,612,480 |
| Size | 2.9 GB | 770.2 MB |
| Events in quadrant A | 26,494,004 | 5,272,475 |
| Events in quadrant B | 22,301,946 | 5,515,812 |
| Events in quadrant C | 19,706,437 | 5,463,099 |
| Events in quadrant D | 23,648,143 | 5,194,371 |
| Mode SS | |||
|---|---|---|---|
| Quadrant | BADHDUFLAG | Total packets | Discarded packets |
| A | 0 | 896 | 0 |
| B | 0 | 896 | 0 |
| C | 0 | 896 | 0 |
| D | 0 | 896 | 0 |
| Mode M9 | |||
|---|---|---|---|
| Quadrant | BADHDUFLAG | Total packets | Discarded packets |
| A | 0 | 75 | 0 |
| B | 0 | 75 | 0 |
| C | 0 | 75 | 0 |
| D | 0 | 75 | 0 |
| Mode M0 | |||
|---|---|---|---|
| Quadrant | BADHDUFLAG | Total packets | Discarded packets |
| A | 0 | 108406 | 0 |
| B | 0 | 95405 | 0 |
| C | 0 | 89498 | 0 |
| D | 0 | 99790 | 0 |
| Quadrant | Total seconds | Saturated seconds | Saturation percentage |
|---|---|---|---|
| A | 43957 | 2592 | 5.896672% |
| B | 43957 | 686 | 1.560616% |
| C | 43957 | 310 | 0.705235% |
| D | 43957 | 629 | 1.430944% |
Noise dominated data is calculated using 1-second bins in cleaned event files. If a bin has >2000 counts, and if more than 50% of those come from <1% of pixels, then it is considered to be noise-dominated and hence unusable.
| Quadrant | # 1 sec bins | Bins with >0 counts | Bins with >2000 counts | High rate bins dominated by noise | Noise dominated (total time) | Noise dominated (detector-on time) | Marked lightcurve |
|---|---|---|---|---|---|---|---|
| A | 51592 | 43966 | 920 | 920 | 1.78% | 2.09% |  |
| B | 51592 | 43966 | 137 | 137 | 0.27% | 0.31% |  |
| C | 51592 | 43966 | 5 | 5 | 0.01% | 0.01% |  |
| D | 51592 | 43966 | 272 | 272 | 0.53% | 0.62% | 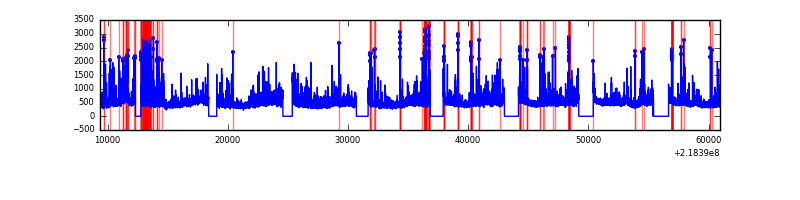 |
Top three noisy pixels from each quadrant. If the there are fewer than three noisy pixels in the level2.evt file, extra rows are filled as -1
| Pixel properties | Quadrant properties | ||||||
|---|---|---|---|---|---|---|---|
| Quadrant | DetID | PixID | Counts | Sigma | Mean | Median | Sigma |
| A | 8 | 15 | 6985464 | 7062.1 | 4972 | 4871 | 988.5 |
| A | 15 | 234 | 161304 | 158.26 | 4972 | 4871 | 988.5 |
| A | 15 | 236 | 128720 | 125.29 | 4972 | 4871 | 988.5 |
| B | 0 | 228 | 661870 | 688.03 | 5145 | 5026 | 954.7 |
| B | 4 | 81 | 651289 | 676.95 | 5145 | 5026 | 954.7 |
| B | 4 | 170 | 363583 | 375.58 | 5145 | 5026 | 954.7 |
| C | 1 | 241 | 73437 | 60.54 | 4988 | 5001 | 1130.4 |
| C | 1 | 16 | 63115 | 51.41 | 4988 | 5001 | 1130.4 |
| C | 13 | 61 | 40041 | 31.0 | 4988 | 5001 | 1130.4 |
| D | 13 | 105 | 1359116 | 1125.63 | 4980 | 4815 | 1203.2 |
| D | 11 | 241 | 1149377 | 951.3 | 4980 | 4815 | 1203.2 |
| D | 2 | 152 | 1012486 | 837.53 | 4980 | 4815 | 1203.2 |
Histogram calculated using DETX and DETY for each event in the final _common_clean file
| Quadrant A |  |
 |
Quadrant B |
|---|---|---|---|
| Quadrant D |  |
 |
Quadrant C |
| Plot type | Count rate plots | Images |
|---|---|---|
| Comparison with Poisson distribution Blue bars denote a histogram of data divided into 1 sec bins. Red curve is a Poisson curve with rate = median count rate of data. |
 |
 |
| Quadrant-wise count rates Data is divided into 100 sec bins |
 |
|
| Module-wise count rates for Quadrant A Data is divided into 100 sec bins |
 |
 |
| Module-wise count rates for Quadrant B Data is divided into 100 sec bins |
 |
 |
| Module-wise count rates for Quadrant C Data is divided into 100 sec bins |
 |
 |
| Module-wise count rates for Quadrant D Data is divided into 100 sec bins |
 |
 |
| Parameter | Plot |
|---|---|
| CZT HV Monitor |  |
| D_VDD |  |
| Temperature 1 |  |
| Veto HV Monitor |  |
| Veto LLD |  |
| Alpha Counter |  |
| _CPM_Rate |  |
| CZT Counter |  |
| +2.5 Volts monitor |  |
| +5 Volts monitor |  |
| _ROLL_ROT |  |
| _Roll_DEC |  |
| _Roll_RA |  |
| Veto Counter |  |