| Param | Original file | Final file |
|---|---|---|
| Filename | modeM0/AS1A02_124T01_9000000842cztM0_level2.evt | modeM0/AS1A02_124T01_9000000842cztM0_level2_quad_clean.evt |
| Size (bytes) | 1,922,950,080 | 366,655,680 |
| Size | 1.8 GB | 349.7 MB |
| Events in quadrant A | 13,569,254 | 2,299,175 |
| Events in quadrant B | 13,871,330 | 2,312,469 |
| Events in quadrant C | 13,330,767 | 2,276,610 |
| Events in quadrant D | 15,489,400 | 2,208,017 |
| Mode M0 | |||
|---|---|---|---|
| Quadrant | BADHDUFLAG | Total packets | Discarded packets |
| A | 0 | 60527 | 0 |
| B | 0 | 61557 | 0 |
| C | 0 | 60709 | 0 |
| D | 0 | 67108 | 0 |
| Mode SS | |||
|---|---|---|---|
| Quadrant | BADHDUFLAG | Total packets | Discarded packets |
| A | 0 | 596 | 0 |
| B | 0 | 596 | 0 |
| C | 0 | 596 | 0 |
| D | 0 | 596 | 0 |
| Mode M9 | |||
|---|---|---|---|
| Quadrant | BADHDUFLAG | Total packets | Discarded packets |
| A | 0 | 27 | 0 |
| B | 0 | 26 | 0 |
| C | 0 | 26 | 0 |
| D | 0 | 27 | 0 |
| Quadrant | Total seconds | Saturated seconds | Saturation percentage |
|---|---|---|---|
| A | 29235 | 311 | 1.063793% |
| B | 29235 | 396 | 1.354541% |
| C | 29235 | 184 | 0.629383% |
| D | 29235 | 593 | 2.028391% |
Noise dominated data is calculated using 1-second bins in cleaned event files. If a bin has >2000 counts, and if more than 50% of those come from <1% of pixels, then it is considered to be noise-dominated and hence unusable.
| Quadrant | # 1 sec bins | Bins with >0 counts | Bins with >2000 counts | High rate bins dominated by noise | Noise dominated (total time) | Noise dominated (detector-on time) | Marked lightcurve |
|---|---|---|---|---|---|---|---|
| A | 30850 | 29241 | 6 | 6 | 0.02% | 0.02% |  |
| B | 30850 | 29241 | 37 | 37 | 0.12% | 0.13% |  |
| C | 30850 | 29241 | 20 | 20 | 0.06% | 0.07% |  |
| D | 30850 | 29241 | 319 | 319 | 1.03% | 1.09% |  |
Top three noisy pixels from each quadrant. If the there are fewer than three noisy pixels in the level2.evt file, extra rows are filled as -1
| Pixel properties | Quadrant properties | ||||||
|---|---|---|---|---|---|---|---|
| Quadrant | DetID | PixID | Counts | Sigma | Mean | Median | Sigma |
| A | 15 | 236 | 479006 | 705.46 | 3352 | 3279 | 674.3 |
| A | 8 | 15 | 86156 | 122.9 | 3352 | 3279 | 674.3 |
| A | 15 | 174 | 72997 | 103.39 | 3352 | 3279 | 674.3 |
| B | 0 | 219 | 284070 | 437.0 | 3381 | 3296 | 642.5 |
| B | 0 | 229 | 248364 | 381.43 | 3381 | 3296 | 642.5 |
| B | 4 | 81 | 114422 | 172.96 | 3381 | 3296 | 642.5 |
| C | 4 | 254 | 434461 | 572.74 | 3272 | 3281 | 752.8 |
| C | 1 | 241 | 61476 | 77.3 | 3272 | 3281 | 752.8 |
| C | 8 | 128 | 32862 | 39.29 | 3272 | 3281 | 752.8 |
| D | 4 | 95 | 1180409 | 1488.21 | 3254 | 3155 | 791.1 |
| D | 2 | 152 | 857346 | 1079.82 | 3254 | 3155 | 791.1 |
| D | 11 | 241 | 359206 | 450.1 | 3254 | 3155 | 791.1 |
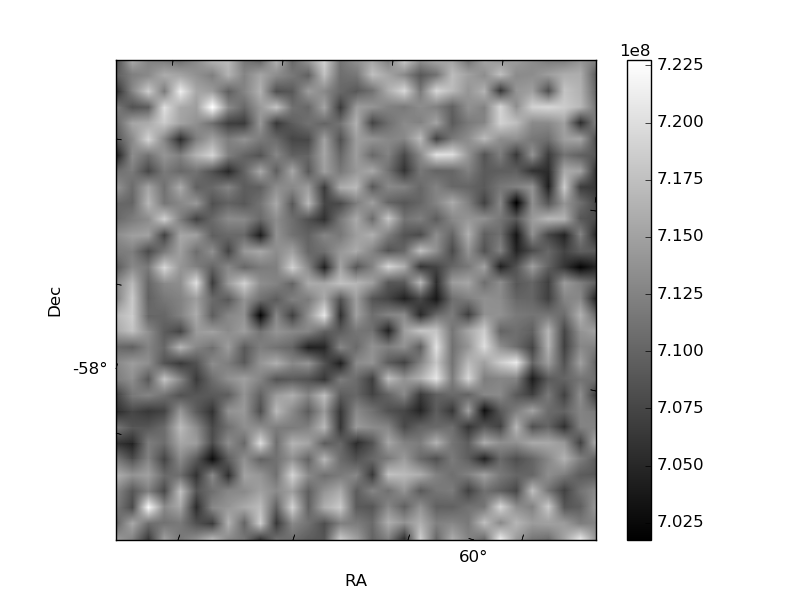
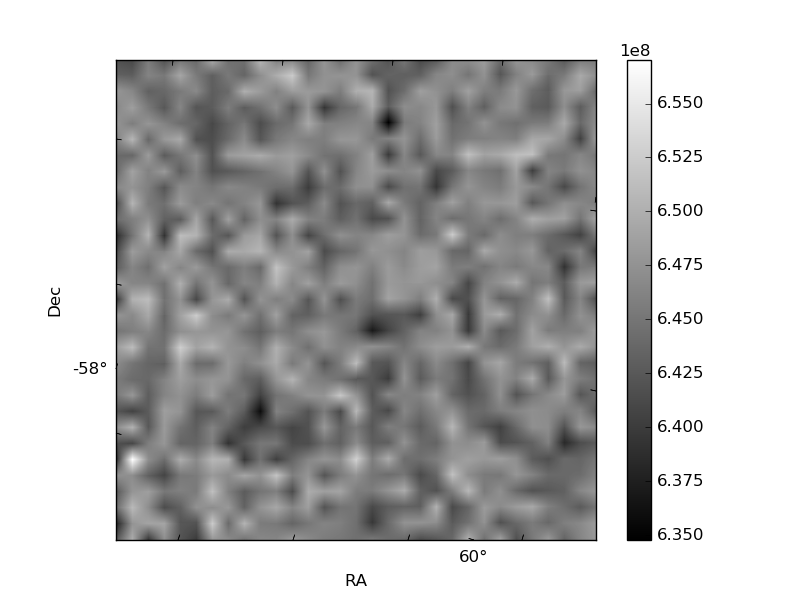
Histogram calculated using DETX and DETY for each event in the final _common_clean file
| Quadrant A |  |
 |
Quadrant B |
|---|---|---|---|
| Quadrant D |  |
 |
Quadrant C |
| Plot type | Count rate plots | Images |
|---|---|---|
| Comparison with Poisson distribution Blue bars denote a histogram of data divided into 1 sec bins. Red curve is a Poisson curve with rate = median count rate of data. |
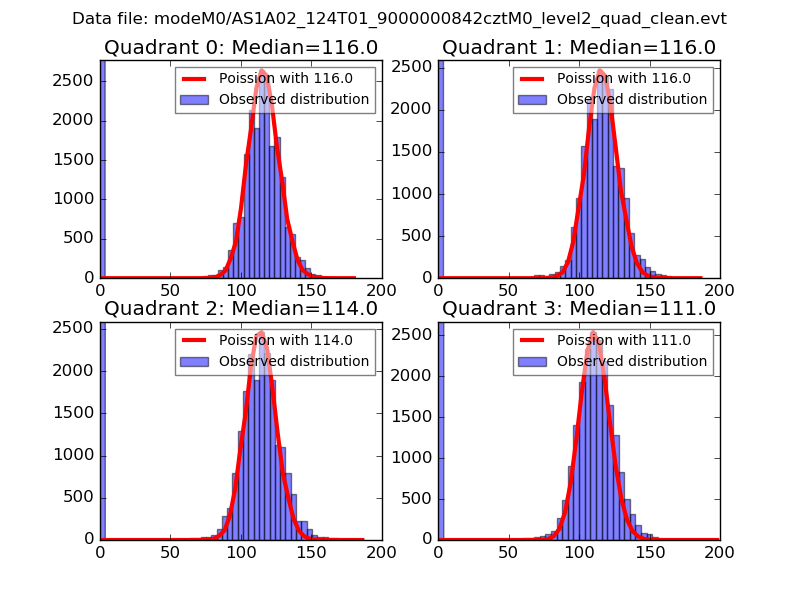 |
 |
| Quadrant-wise count rates Data is divided into 100 sec bins |
 |
|
| Module-wise count rates for Quadrant A Data is divided into 100 sec bins |
 |
 |
| Module-wise count rates for Quadrant B Data is divided into 100 sec bins |
 |
 |
| Module-wise count rates for Quadrant C Data is divided into 100 sec bins |
 |
 |
| Module-wise count rates for Quadrant D Data is divided into 100 sec bins |
 |
 |
| Parameter | Plot |
|---|---|
| CZT HV Monitor |  |
| D_VDD |  |
| Temperature 1 |  |
| Veto HV Monitor |  |
| Veto LLD |  |
| Alpha Counter |  |
| _CPM_Rate |  |
| CZT Counter |  |
| +2.5 Volts monitor | 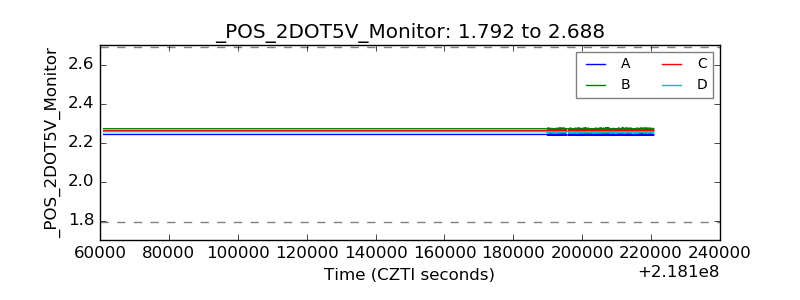 |
| +5 Volts monitor |  |
| _ROLL_ROT |  |
| _Roll_DEC |  |
| _Roll_RA | 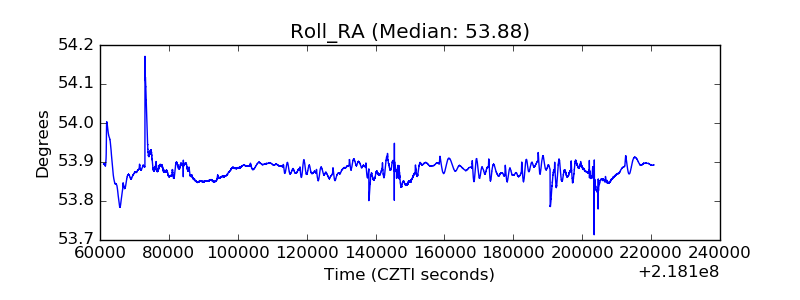 |
| Veto Counter |  |