| Param | Original file | Final file |
|---|---|---|
| Filename | modeM0/AS1G06_132T01_9000000838cztM0_level2.evt | modeM0/AS1G06_132T01_9000000838cztM0_level2_quad_clean.evt |
| Size (bytes) | 2,165,590,080 | 314,847,360 |
| Size | 2.0 GB | 300.3 MB |
| Events in quadrant A | 12,275,809 | 2,011,538 |
| Events in quadrant B | 16,096,301 | 1,965,387 |
| Events in quadrant C | 11,801,279 | 2,004,539 |
| Events in quadrant D | 23,669,864 | 1,775,687 |
| Mode M0 | |||
|---|---|---|---|
| Quadrant | BADHDUFLAG | Total packets | Discarded packets |
| A | 0 | 54232 | 0 |
| B | 0 | 65346 | 0 |
| C | 0 | 54096 | 0 |
| D | 0 | 88058 | 0 |
| Mode M9 | |||
|---|---|---|---|
| Quadrant | BADHDUFLAG | Total packets | Discarded packets |
| A | 0 | 23 | 0 |
| B | 0 | 23 | 0 |
| C | 0 | 23 | 0 |
| D | 0 | 23 | 0 |
| Mode SS | |||
|---|---|---|---|
| Quadrant | BADHDUFLAG | Total packets | Discarded packets |
| A | 0 | 528 | 0 |
| B | 0 | 528 | 0 |
| C | 0 | 528 | 0 |
| D | 0 | 528 | 0 |
| Quadrant | Total seconds | Saturated seconds | Saturation percentage |
|---|---|---|---|
| A | 25853 | 218 | 0.843229% |
| B | 25853 | 1387 | 5.364948% |
| C | 25853 | 170 | 0.657564% |
| D | 25853 | 2704 | 10.459134% |
Noise dominated data is calculated using 1-second bins in cleaned event files. If a bin has >2000 counts, and if more than 50% of those come from <1% of pixels, then it is considered to be noise-dominated and hence unusable.
| Quadrant | # 1 sec bins | Bins with >0 counts | Bins with >2000 counts | High rate bins dominated by noise | Noise dominated (total time) | Noise dominated (detector-on time) | Marked lightcurve |
|---|---|---|---|---|---|---|---|
| A | 28003 | 25860 | 21 | 21 | 0.07% | 0.08% |  |
| B | 28003 | 25860 | 725 | 725 | 2.59% | 2.80% |  |
| C | 28003 | 25860 | 55 | 55 | 0.20% | 0.21% |  |
| D | 28003 | 25860 | 2510 | 2510 | 8.96% | 9.71% | 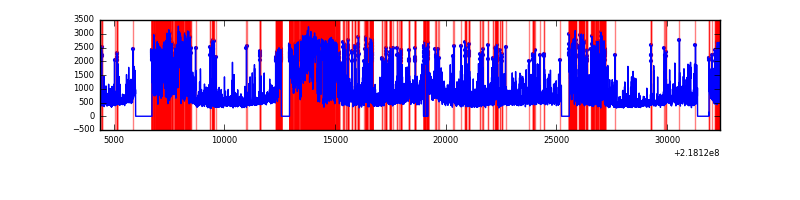 |
Top three noisy pixels from each quadrant. If the there are fewer than three noisy pixels in the level2.evt file, extra rows are filled as -1
| Pixel properties | Quadrant properties | ||||||
|---|---|---|---|---|---|---|---|
| Quadrant | DetID | PixID | Counts | Sigma | Mean | Median | Sigma |
| A | 15 | 236 | 382492 | 632.4 | 2979 | 2909 | 600.2 |
| A | 13 | 251 | 141590 | 231.05 | 2979 | 2909 | 600.2 |
| A | 3 | 1 | 101038 | 163.49 | 2979 | 2909 | 600.2 |
| B | 3 | 64 | 3488467 | 6196.68 | 2953 | 2885 | 562.5 |
| B | 0 | 219 | 353015 | 622.46 | 2953 | 2885 | 562.5 |
| B | 15 | 204 | 270728 | 476.17 | 2953 | 2885 | 562.5 |
| C | 4 | 254 | 492562 | 737.58 | 2878 | 2883 | 663.9 |
| C | 9 | 54 | 38316 | 53.37 | 2878 | 2883 | 663.9 |
| C | 13 | 61 | 23000 | 30.3 | 2878 | 2883 | 663.9 |
| D | 12 | 220 | 4782497 | 7072.69 | 2773 | 2683 | 675.8 |
| D | 12 | 221 | 2842569 | 4202.18 | 2773 | 2683 | 675.8 |
| D | 1 | 239 | 2251072 | 3326.94 | 2773 | 2683 | 675.8 |
Histogram calculated using DETX and DETY for each event in the final _common_clean file
| Quadrant A |  |
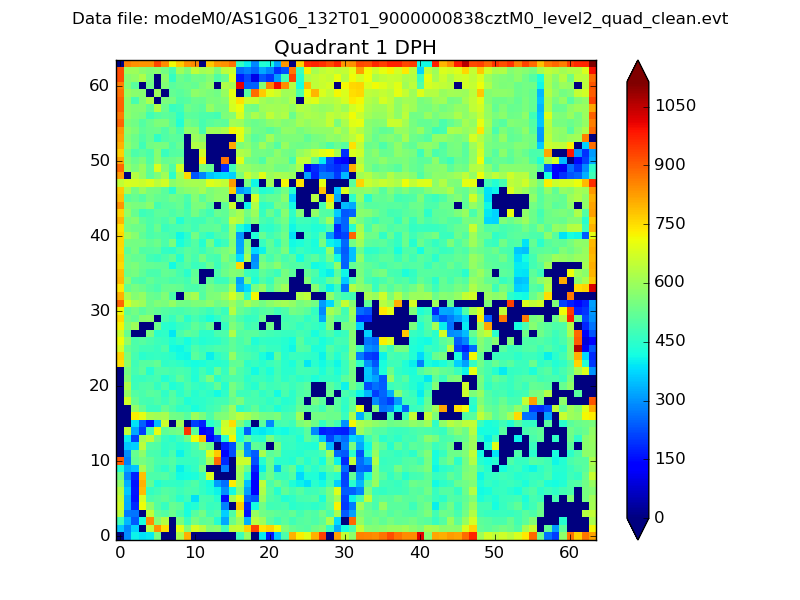 |
Quadrant B |
|---|---|---|---|
| Quadrant D |  |
 |
Quadrant C |
| Plot type | Count rate plots | Images |
|---|---|---|
| Comparison with Poisson distribution Blue bars denote a histogram of data divided into 1 sec bins. Red curve is a Poisson curve with rate = median count rate of data. |
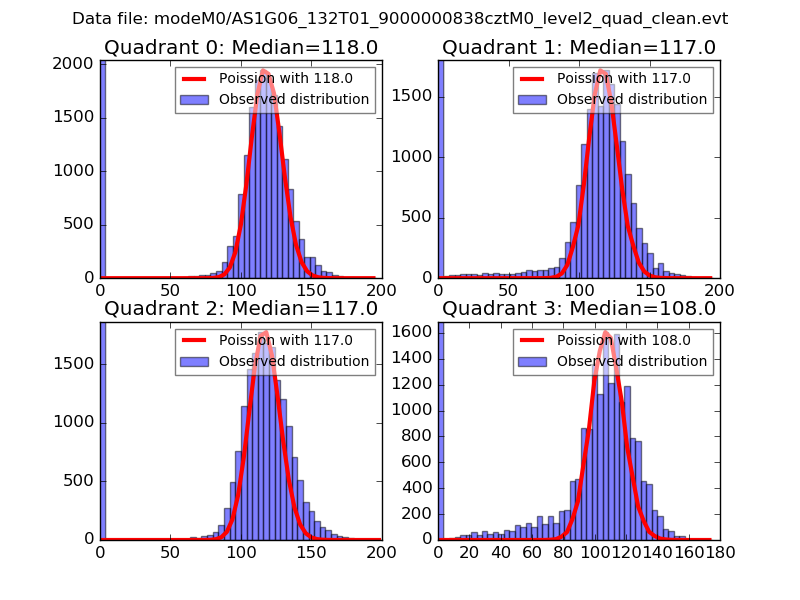 |
 |
| Quadrant-wise count rates Data is divided into 100 sec bins |
 |
|
| Module-wise count rates for Quadrant A Data is divided into 100 sec bins |
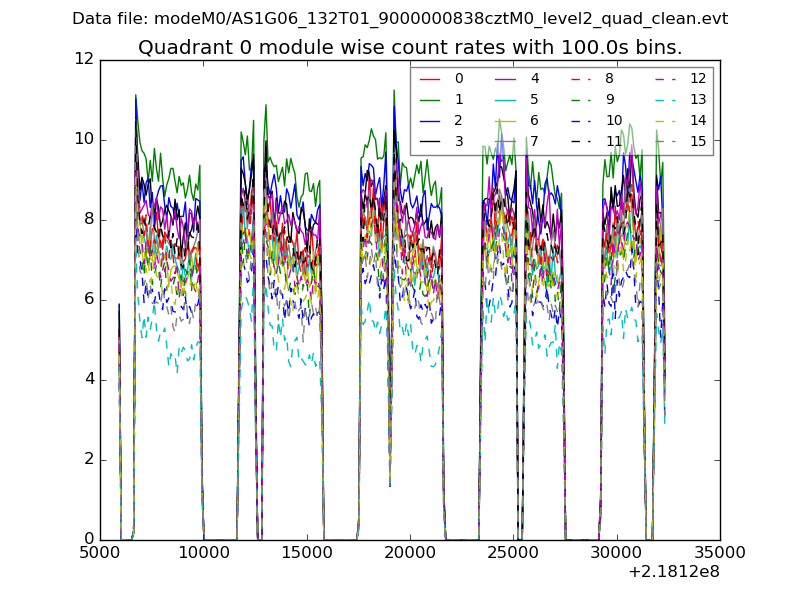 |
 |
| Module-wise count rates for Quadrant B Data is divided into 100 sec bins |
 |
 |
| Module-wise count rates for Quadrant C Data is divided into 100 sec bins |
 |
 |
| Module-wise count rates for Quadrant D Data is divided into 100 sec bins |
 |
 |
| Parameter | Plot |
|---|---|
| CZT HV Monitor | 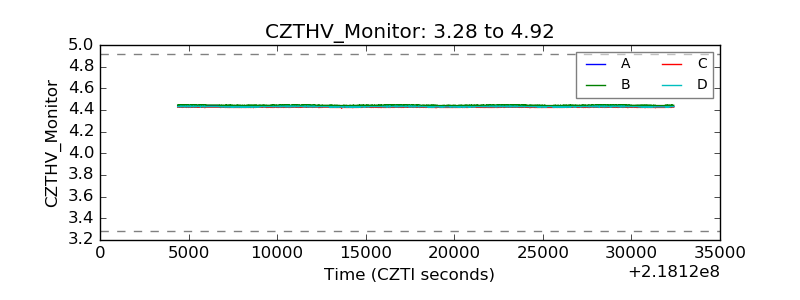 |
| D_VDD |  |
| Temperature 1 |  |
| Veto HV Monitor |  |
| Veto LLD |  |
| Alpha Counter |  |
| _CPM_Rate |  |
| CZT Counter |  |
| +2.5 Volts monitor |  |
| +5 Volts monitor |  |
| _ROLL_ROT |  |
| _Roll_DEC |  |
| _Roll_RA | 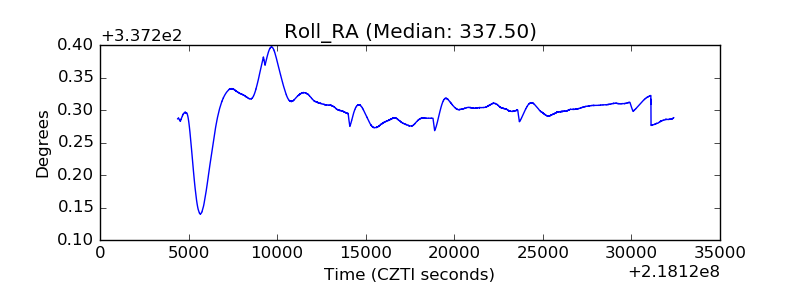 |
| Veto Counter |  |