| Param | Original file | Final file |
|---|---|---|
| Filename | modeM0/AS1G06_151T01_9000000836cztM0_level2.evt | modeM0/AS1G06_151T01_9000000836cztM0_level2_quad_clean.evt |
| Size (bytes) | 5,062,170,240 | 737,023,680 |
| Size | 4.7 GB | 702.9 MB |
| Events in quadrant A | 30,184,601 | 4,679,153 |
| Events in quadrant B | 35,664,775 | 4,622,980 |
| Events in quadrant C | 27,828,999 | 4,620,048 |
| Events in quadrant D | 55,536,374 | 4,228,553 |
| Mode M0 | |||
|---|---|---|---|
| Quadrant | BADHDUFLAG | Total packets | Discarded packets |
| A | 0 | 129194 | 0 |
| B | 0 | 146148 | 0 |
| C | 0 | 125266 | 0 |
| D | 0 | 206124 | 0 |
| Mode M9 | |||
|---|---|---|---|
| Quadrant | BADHDUFLAG | Total packets | Discarded packets |
| A | 0 | 103 | 0 |
| B | 0 | 103 | 0 |
| C | 0 | 103 | 0 |
| D | 0 | 103 | 0 |
| Mode SS | |||
|---|---|---|---|
| Quadrant | BADHDUFLAG | Total packets | Discarded packets |
| A | 0 | 1236 | 0 |
| B | 0 | 1236 | 0 |
| C | 0 | 1236 | 0 |
| D | 0 | 1236 | 0 |
| Quadrant | Total seconds | Saturated seconds | Saturation percentage |
|---|---|---|---|
| A | 60825 | 696 | 1.144266% |
| B | 60825 | 2435 | 4.003288% |
| C | 60825 | 399 | 0.655980% |
| D | 60825 | 6263 | 10.296753% |
Noise dominated data is calculated using 1-second bins in cleaned event files. If a bin has >2000 counts, and if more than 50% of those come from <1% of pixels, then it is considered to be noise-dominated and hence unusable.
| Quadrant | # 1 sec bins | Bins with >0 counts | Bins with >2000 counts | High rate bins dominated by noise | Noise dominated (total time) | Noise dominated (detector-on time) | Marked lightcurve |
|---|---|---|---|---|---|---|---|
| A | 70870 | 60837 | 112 | 112 | 0.16% | 0.18% |  |
| B | 70870 | 60837 | 1333 | 1333 | 1.88% | 2.19% |  |
| C | 70870 | 60837 | 27 | 27 | 0.04% | 0.04% |  |
| D | 70870 | 60837 | 5145 | 5145 | 7.26% | 8.46% |  |
Top three noisy pixels from each quadrant. If the there are fewer than three noisy pixels in the level2.evt file, extra rows are filled as -1
| Pixel properties | Quadrant properties | ||||||
|---|---|---|---|---|---|---|---|
| Quadrant | DetID | PixID | Counts | Sigma | Mean | Median | Sigma |
| A | 14 | 111 | 805164 | 544.44 | 7242 | 7088 | 1465.9 |
| A | 13 | 251 | 607389 | 409.52 | 7242 | 7088 | 1465.9 |
| A | 15 | 236 | 459547 | 308.66 | 7242 | 7088 | 1465.9 |
| B | 3 | 64 | 7177686 | 5262.42 | 7189 | 7032 | 1362.6 |
| B | 15 | 204 | 201253 | 142.54 | 7189 | 7032 | 1362.6 |
| B | 12 | 111 | 137189 | 95.52 | 7189 | 7032 | 1362.6 |
| C | 4 | 254 | 278635 | 168.8 | 6989 | 7030 | 1609.1 |
| C | 9 | 54 | 81748 | 46.44 | 6989 | 7030 | 1609.1 |
| C | 9 | 16 | 74190 | 41.74 | 6989 | 7030 | 1609.1 |
| D | 12 | 221 | 9135542 | 5586.94 | 6721 | 6524 | 1634.0 |
| D | 4 | 95 | 8511295 | 5204.9 | 6721 | 6524 | 1634.0 |
| D | 12 | 220 | 7578155 | 4633.82 | 6721 | 6524 | 1634.0 |
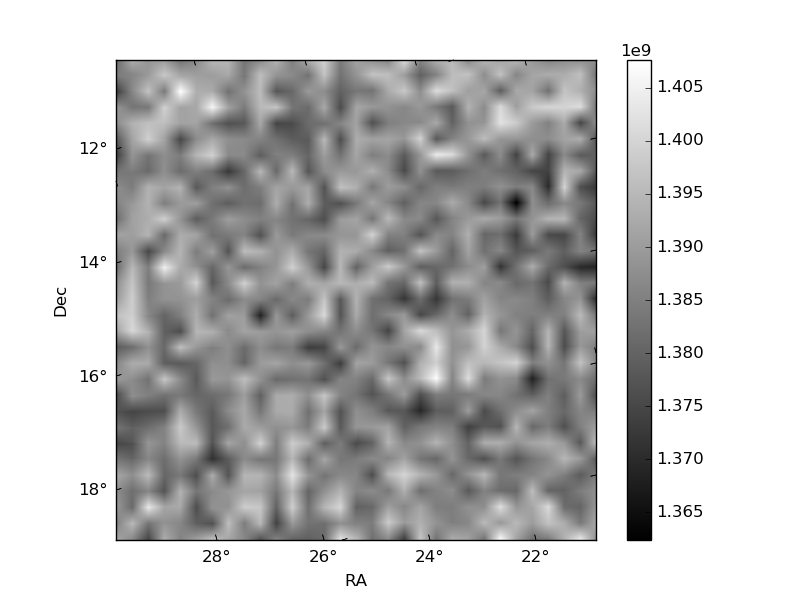
Histogram calculated using DETX and DETY for each event in the final _common_clean file
| Quadrant A |  |
 |
Quadrant B |
|---|---|---|---|
| Quadrant D |  |
 |
Quadrant C |
| Plot type | Count rate plots | Images |
|---|---|---|
| Comparison with Poisson distribution Blue bars denote a histogram of data divided into 1 sec bins. Red curve is a Poisson curve with rate = median count rate of data. |
 |
 |
| Quadrant-wise count rates Data is divided into 100 sec bins |
 |
|
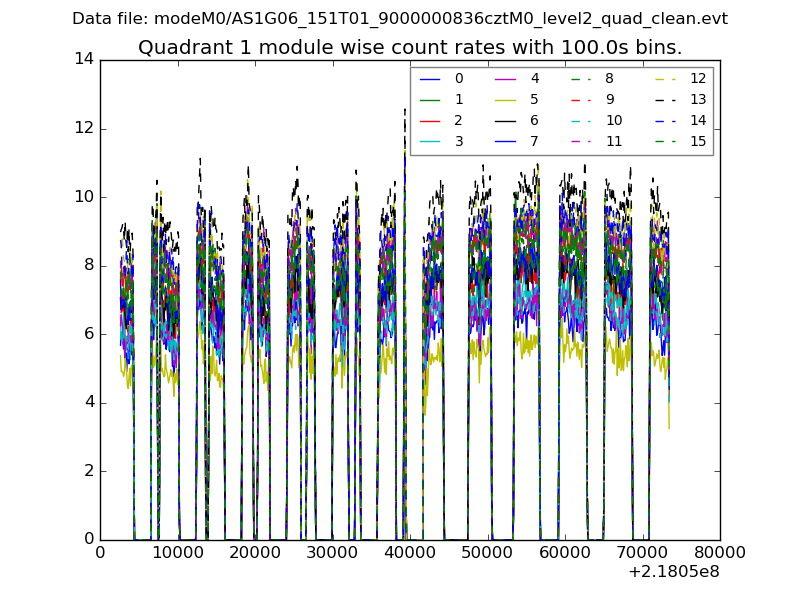
| Module-wise count rates for Quadrant A Data is divided into 100 sec bins |
 |
 |
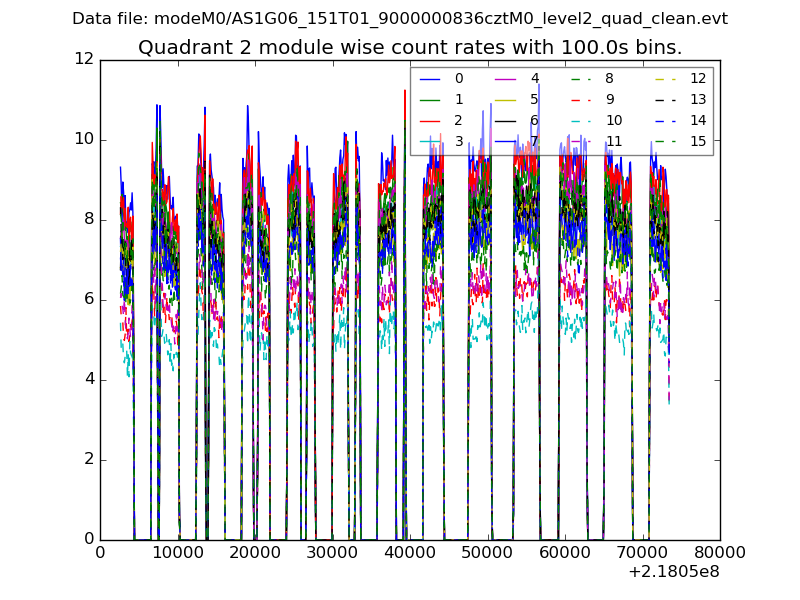
| Module-wise count rates for Quadrant B Data is divided into 100 sec bins |
 |
 |
| Module-wise count rates for Quadrant C Data is divided into 100 sec bins |
 |
 |
| Module-wise count rates for Quadrant D Data is divided into 100 sec bins |
 |
 |
| Parameter | Plot |
|---|---|
| CZT HV Monitor | 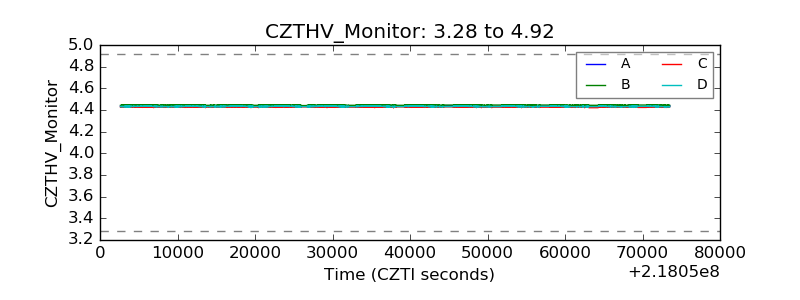 |
| D_VDD |  |
| Temperature 1 |  |
| Veto HV Monitor |  |
| Veto LLD |  |
| Alpha Counter |  |
| _CPM_Rate |  |
| CZT Counter | 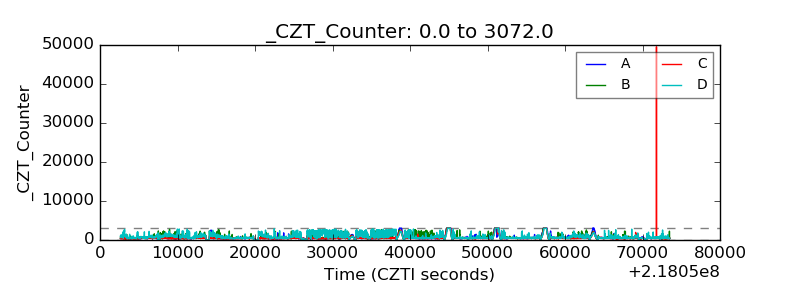 |
| +2.5 Volts monitor |  |
| +5 Volts monitor | 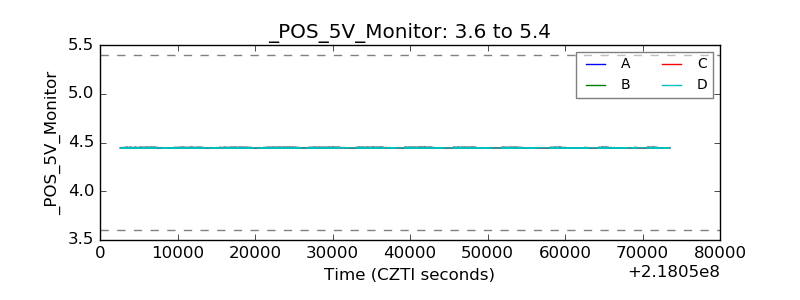 |
| _ROLL_ROT |  |
| _Roll_DEC |  |
| _Roll_RA |  |
| Veto Counter | 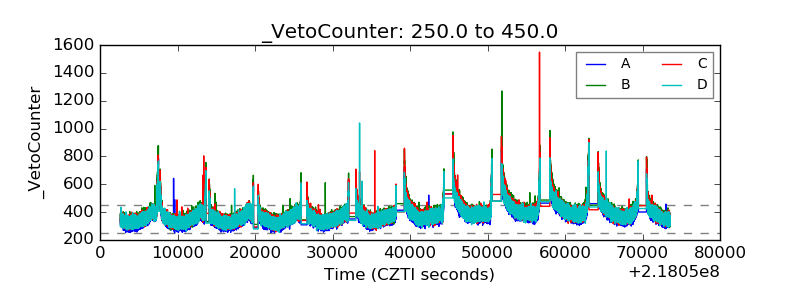 |