| Param | Original file | Final file |
|---|---|---|
| Filename | modeM0/AS1G06_028T01_9000000834cztM0_level2.evt | modeM0/AS1G06_028T01_9000000834cztM0_level2_quad_clean.evt |
| Size (bytes) | 2,812,498,560 | 460,630,080 |
| Size | 2.6 GB | 439.3 MB |
| Events in quadrant A | 15,962,624 | 3,039,491 |
| Events in quadrant B | 19,712,785 | 3,014,774 |
| Events in quadrant C | 16,112,546 | 2,963,073 |
| Events in quadrant D | 31,210,138 | 2,709,621 |
| Mode M0 | |||
|---|---|---|---|
| Quadrant | BADHDUFLAG | Total packets | Discarded packets |
| A | 0 | 68796 | 0 |
| B | 0 | 79781 | 0 |
| C | 0 | 69710 | 0 |
| D | 0 | 115289 | 0 |
| Mode M9 | |||
|---|---|---|---|
| Quadrant | BADHDUFLAG | Total packets | Discarded packets |
| A | 0 | 69 | 0 |
| B | 0 | 69 | 0 |
| C | 0 | 69 | 0 |
| D | 0 | 69 | 0 |
| Mode SS | |||
|---|---|---|---|
| Quadrant | BADHDUFLAG | Total packets | Discarded packets |
| A | 0 | 658 | 0 |
| B | 0 | 658 | 0 |
| C | 0 | 658 | 0 |
| D | 0 | 658 | 0 |
| Quadrant | Total seconds | Saturated seconds | Saturation percentage |
|---|---|---|---|
| A | 32389 | 542 | 1.673408% |
| B | 32389 | 1471 | 4.541665% |
| C | 32389 | 455 | 1.404798% |
| D | 32389 | 2510 | 7.749545% |
Noise dominated data is calculated using 1-second bins in cleaned event files. If a bin has >2000 counts, and if more than 50% of those come from <1% of pixels, then it is considered to be noise-dominated and hence unusable.
| Quadrant | # 1 sec bins | Bins with >0 counts | Bins with >2000 counts | High rate bins dominated by noise | Noise dominated (total time) | Noise dominated (detector-on time) | Marked lightcurve |
|---|---|---|---|---|---|---|---|
| A | 39084 | 32396 | 24 | 24 | 0.06% | 0.07% |  |
| B | 39084 | 32396 | 743 | 743 | 1.90% | 2.29% |  |
| C | 39084 | 32396 | 153 | 153 | 0.39% | 0.47% |  |
| D | 39084 | 32396 | 1965 | 1965 | 5.03% | 6.07% |  |
Top three noisy pixels from each quadrant. If the there are fewer than three noisy pixels in the level2.evt file, extra rows are filled as -1
| Pixel properties | Quadrant properties | ||||||
|---|---|---|---|---|---|---|---|
| Quadrant | DetID | PixID | Counts | Sigma | Mean | Median | Sigma |
| A | 13 | 251 | 318558 | 393.06 | 3969 | 3895 | 800.6 |
| A | 8 | 15 | 156645 | 190.81 | 3969 | 3895 | 800.6 |
| A | 14 | 111 | 83124 | 98.97 | 3969 | 3895 | 800.6 |
| B | 3 | 64 | 3736114 | 5056.67 | 3934 | 3852 | 738.1 |
| B | 4 | 81 | 575620 | 774.66 | 3934 | 3852 | 738.1 |
| B | 15 | 204 | 149547 | 197.4 | 3934 | 3852 | 738.1 |
| C | 4 | 254 | 1136591 | 1286.97 | 3820 | 3854 | 880.2 |
| C | 9 | 16 | 70933 | 76.21 | 3820 | 3854 | 880.2 |
| C | 13 | 61 | 29905 | 29.6 | 3820 | 3854 | 880.2 |
| D | 12 | 221 | 9931940 | 10755.8 | 3767 | 3657 | 923.1 |
| D | 12 | 220 | 4554707 | 4930.38 | 3767 | 3657 | 923.1 |
| D | 2 | 63 | 753623 | 812.47 | 3767 | 3657 | 923.1 |
Histogram calculated using DETX and DETY for each event in the final _common_clean file
| Quadrant A |  |
 |
Quadrant B |
|---|---|---|---|
| Quadrant D |  |
 |
Quadrant C |
| Plot type | Count rate plots | Images |
|---|---|---|
| Comparison with Poisson distribution Blue bars denote a histogram of data divided into 1 sec bins. Red curve is a Poisson curve with rate = median count rate of data. |
 |
 |
| Quadrant-wise count rates Data is divided into 100 sec bins |
 |
|
| Module-wise count rates for Quadrant A Data is divided into 100 sec bins |
 |
 |
| Module-wise count rates for Quadrant B Data is divided into 100 sec bins |
 |
 |
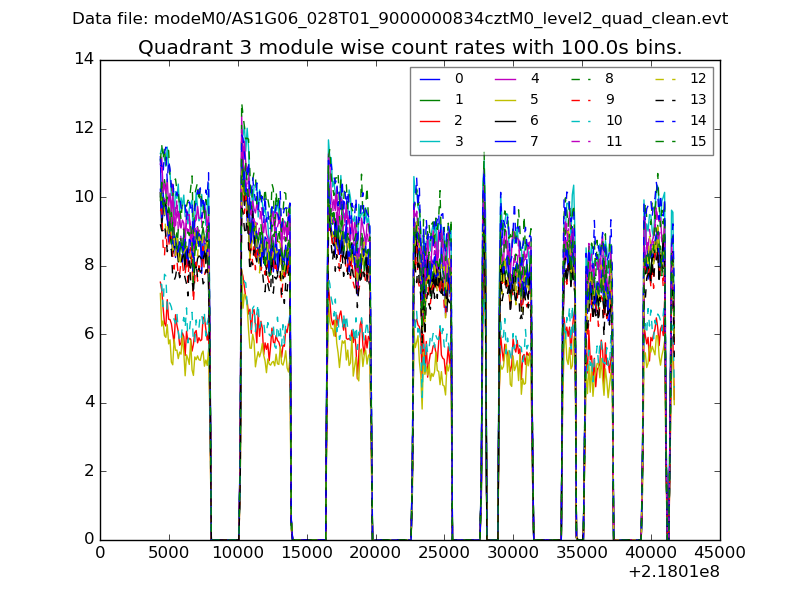
| Module-wise count rates for Quadrant C Data is divided into 100 sec bins |
 |
 |
| Module-wise count rates for Quadrant D Data is divided into 100 sec bins |
 |
 |
| Parameter | Plot |
|---|---|
| CZT HV Monitor |  |
| D_VDD |  |
| Temperature 1 |  |
| Veto HV Monitor |  |
| Veto LLD |  |
| Alpha Counter |  |
| _CPM_Rate |  |
| CZT Counter |  |
| +2.5 Volts monitor |  |
| +5 Volts monitor | 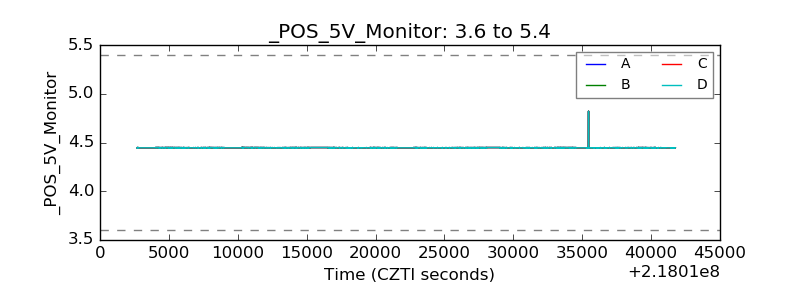 |
| _ROLL_ROT |  |
| _Roll_DEC |  |
| _Roll_RA |  |
| Veto Counter |  |