| Param | Original file | Final file |
|---|---|---|
| Filename | modeM0/AS1G06_168T25_9000000830cztM0_level2.evt | modeM0/AS1G06_168T25_9000000830cztM0_level2_quad_clean.evt |
| Size (bytes) | 954,322,560 | 101,226,240 |
| Size | 910.1 MB | 96.5 MB |
| Events in quadrant A | 5,297,021 | 649,815 |
| Events in quadrant B | 5,298,925 | 655,362 |
| Events in quadrant C | 4,053,388 | 666,631 |
| Events in quadrant D | 13,645,102 | 467,664 |
| Mode SS | |||
|---|---|---|---|
| Quadrant | BADHDUFLAG | Total packets | Discarded packets |
| A | 0 | 184 | 0 |
| B | 0 | 184 | 0 |
| C | 0 | 184 | 0 |
| D | 0 | 184 | 0 |
| Mode M0 | |||
|---|---|---|---|
| Quadrant | BADHDUFLAG | Total packets | Discarded packets |
| A | 0 | 21557 | 0 |
| B | 0 | 21722 | 0 |
| C | 0 | 18329 | 0 |
| D | 0 | 46758 | 0 |
| Mode M9 | |||
|---|---|---|---|
| Quadrant | BADHDUFLAG | Total packets | Discarded packets |
| A | 0 | 7 | 0 |
| B | 0 | 7 | 0 |
| C | 0 | 7 | 0 |
| D | 0 | 7 | 0 |
| Quadrant | Total seconds | Saturated seconds | Saturation percentage |
|---|---|---|---|
| A | 8997 | 150 | 1.667222% |
| B | 8997 | 323 | 3.590086% |
| C | 8997 | 19 | 0.211182% |
| D | 8997 | 3101 | 34.467045% |
Noise dominated data is calculated using 1-second bins in cleaned event files. If a bin has >2000 counts, and if more than 50% of those come from <1% of pixels, then it is considered to be noise-dominated and hence unusable.
| Quadrant | # 1 sec bins | Bins with >0 counts | Bins with >2000 counts | High rate bins dominated by noise | Noise dominated (total time) | Noise dominated (detector-on time) | Marked lightcurve |
|---|---|---|---|---|---|---|---|
| A | 9682 | 8998 | 29 | 29 | 0.30% | 0.32% |  |
| B | 9682 | 8998 | 199 | 199 | 2.06% | 2.21% |  |
| C | 9682 | 8999 | 0 | 0 | 0.00% | 0.00% | 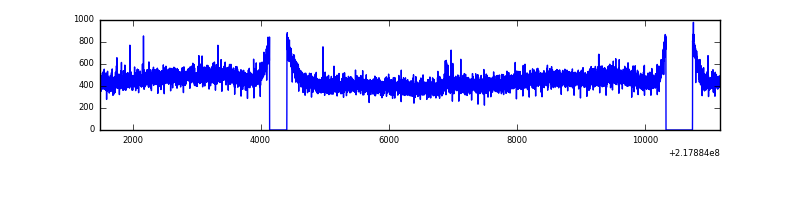 |
| D | 9681 | 8996 | 2860 | 2860 | 29.54% | 31.79% |  |
Top three noisy pixels from each quadrant. If the there are fewer than three noisy pixels in the level2.evt file, extra rows are filled as -1
| Pixel properties | Quadrant properties | ||||||
|---|---|---|---|---|---|---|---|
| Quadrant | DetID | PixID | Counts | Sigma | Mean | Median | Sigma |
| A | 8 | 15 | 762192 | 3478.17 | 1060 | 1036 | 218.8 |
| A | 13 | 251 | 220843 | 1004.43 | 1060 | 1036 | 218.8 |
| A | 15 | 236 | 131951 | 598.23 | 1060 | 1036 | 218.8 |
| B | 3 | 64 | 856259 | 4129.06 | 1062 | 1038 | 207.1 |
| B | 0 | 219 | 144979 | 694.96 | 1062 | 1038 | 207.1 |
| B | 4 | 81 | 126830 | 607.33 | 1062 | 1038 | 207.1 |
| C | 9 | 54 | 12952 | 50.01 | 1030 | 1035 | 238.3 |
| C | 13 | 61 | 8324 | 30.59 | 1030 | 1035 | 238.3 |
| C | 1 | 16 | 6731 | 23.9 | 1030 | 1035 | 238.3 |
| D | 2 | 63 | 8907246 | 40777.94 | 885 | 856 | 218.4 |
| D | 12 | 220 | 890394 | 4072.75 | 885 | 856 | 218.4 |
| D | 2 | 14 | 135118 | 614.72 | 885 | 856 | 218.4 |
Histogram calculated using DETX and DETY for each event in the final _common_clean file
| Quadrant A |  |
 |
Quadrant B |
|---|---|---|---|
| Quadrant D |  |
 |
Quadrant C |
| Plot type | Count rate plots | Images |
|---|---|---|
| Comparison with Poisson distribution Blue bars denote a histogram of data divided into 1 sec bins. Red curve is a Poisson curve with rate = median count rate of data. |
 |
 |
| Quadrant-wise count rates Data is divided into 100 sec bins |
 |
|
| Module-wise count rates for Quadrant A Data is divided into 100 sec bins |
 |
 |
| Module-wise count rates for Quadrant B Data is divided into 100 sec bins |
 |
 |
| Module-wise count rates for Quadrant C Data is divided into 100 sec bins |
 |
 |
| Module-wise count rates for Quadrant D Data is divided into 100 sec bins |
 |
 |
| Parameter | Plot |
|---|---|
| CZT HV Monitor |  |
| D_VDD |  |
| Temperature 1 | 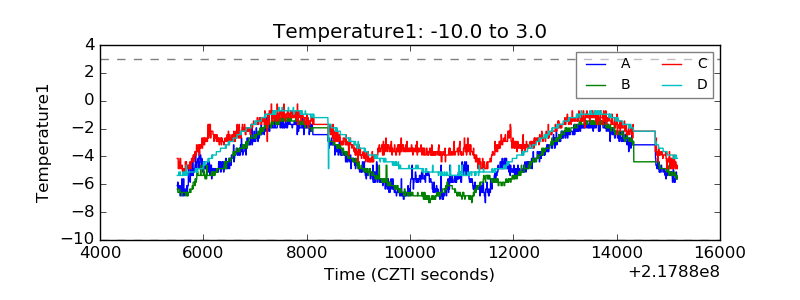 |
| Veto HV Monitor | 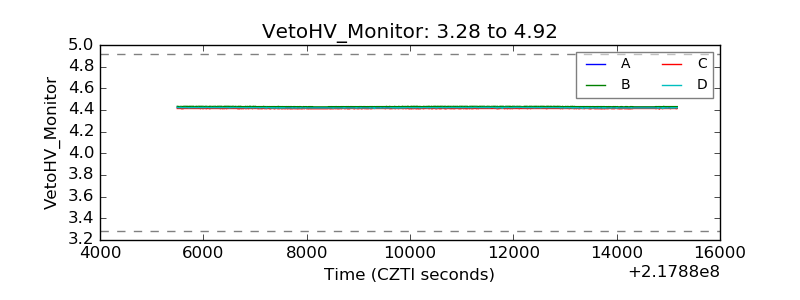 |
| Veto LLD |  |
| Alpha Counter |  |
| _CPM_Rate |  |
| CZT Counter |  |
| +2.5 Volts monitor | 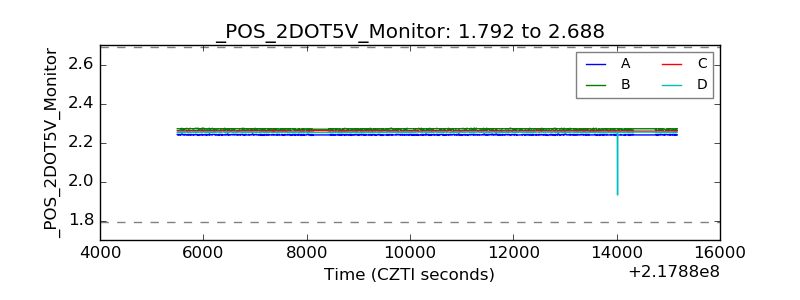 |
| +5 Volts monitor |  |
| _ROLL_ROT |  |
| _Roll_DEC |  |
| _Roll_RA | 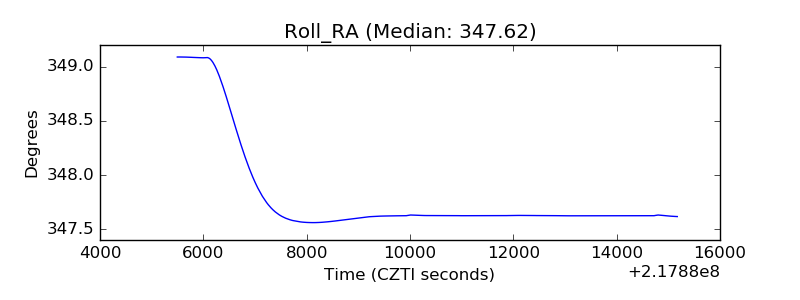 |
| Veto Counter |  |