| Param | Original file | Final file |
|---|---|---|
| Filename | modeM0/AS1A02_173T03_9000000828cztM0_level2.evt | modeM0/AS1A02_173T03_9000000828cztM0_level2_quad_clean.evt |
| Size (bytes) | 531,244,800 | 83,640,960 |
| Size | 506.6 MB | 79.8 MB |
| Events in quadrant A | 3,505,333 | 550,972 |
| Events in quadrant B | 3,147,022 | 548,834 |
| Events in quadrant C | 2,458,463 | 546,717 |
| Events in quadrant D | 6,595,406 | 491,013 |
| Mode SS | |||
|---|---|---|---|
| Quadrant | BADHDUFLAG | Total packets | Discarded packets |
| A | 0 | 114 | 0 |
| B | 0 | 114 | 0 |
| C | 0 | 114 | 0 |
| D | 0 | 114 | 0 |
| Mode M9 | |||
|---|---|---|---|
| Quadrant | BADHDUFLAG | Total packets | Discarded packets |
| A | 0 | 3 | 0 |
| B | 0 | 3 | 0 |
| C | 0 | 3 | 0 |
| D | 0 | 3 | 0 |
| Mode M0 | |||
|---|---|---|---|
| Quadrant | BADHDUFLAG | Total packets | Discarded packets |
| A | 0 | 14121 | 0 |
| B | 0 | 13238 | 0 |
| C | 0 | 11606 | 0 |
| D | 0 | 23563 | 0 |
| Quadrant | Total seconds | Saturated seconds | Saturation percentage |
|---|---|---|---|
| A | 5650 | 80 | 1.415929% |
| B | 5650 | 176 | 3.115044% |
| C | 5650 | 38 | 0.672566% |
| D | 5650 | 822 | 14.548673% |
Noise dominated data is calculated using 1-second bins in cleaned event files. If a bin has >2000 counts, and if more than 50% of those come from <1% of pixels, then it is considered to be noise-dominated and hence unusable.
| Quadrant | # 1 sec bins | Bins with >0 counts | Bins with >2000 counts | High rate bins dominated by noise | Noise dominated (total time) | Noise dominated (detector-on time) | Marked lightcurve |
|---|---|---|---|---|---|---|---|
| A | 5950 | 5651 | 5 | 5 | 0.08% | 0.09% |  |
| B | 5950 | 5650 | 85 | 85 | 1.43% | 1.50% | 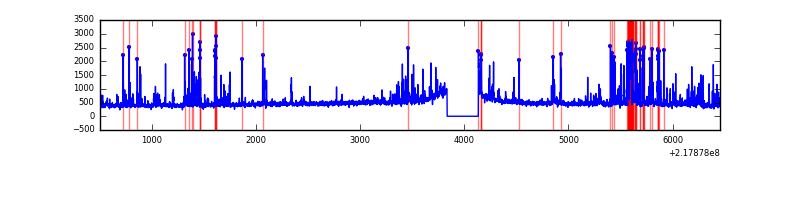 |
| C | 5950 | 5650 | 0 | 0 | 0.00% | 0.00% |  |
| D | 5950 | 5650 | 617 | 617 | 10.37% | 10.92% |  |
Top three noisy pixels from each quadrant. If the there are fewer than three noisy pixels in the level2.evt file, extra rows are filled as -1
| Pixel properties | Quadrant properties | ||||||
|---|---|---|---|---|---|---|---|
| Quadrant | DetID | PixID | Counts | Sigma | Mean | Median | Sigma |
| A | 8 | 15 | 642060 | 4909.66 | 638 | 622 | 130.6 |
| A | 15 | 236 | 235317 | 1796.39 | 638 | 622 | 130.6 |
| A | 13 | 251 | 89378 | 679.35 | 638 | 622 | 130.6 |
| B | 0 | 219 | 281169 | 2260.83 | 643 | 627 | 124.1 |
| B | 3 | 64 | 263174 | 2115.81 | 643 | 627 | 124.1 |
| B | 4 | 81 | 46811 | 372.19 | 643 | 627 | 124.1 |
| C | 8 | 128 | 5751 | 35.02 | 625 | 626 | 146.3 |
| C | 13 | 61 | 5007 | 29.94 | 625 | 626 | 146.3 |
| C | 8 | 112 | 3366 | 18.72 | 625 | 626 | 146.3 |
| D | 2 | 63 | 3279286 | 22485.3 | 594 | 575 | 145.8 |
| D | 12 | 220 | 846391 | 5800.58 | 594 | 575 | 145.8 |
| D | 14 | 34 | 51515 | 349.34 | 594 | 575 | 145.8 |
Histogram calculated using DETX and DETY for each event in the final _common_clean file
| Quadrant A | 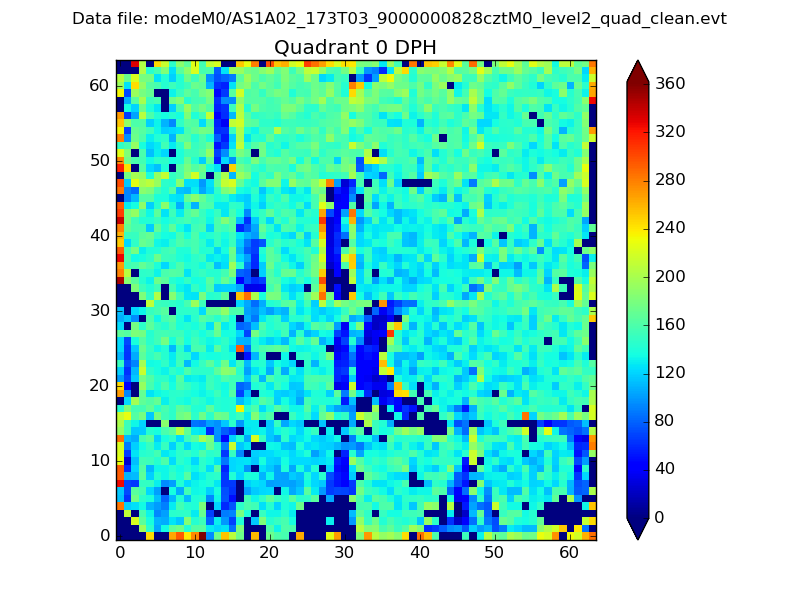 |
 |
Quadrant B |
|---|---|---|---|
| Quadrant D |  |
 |
Quadrant C |
| Plot type | Count rate plots | Images |
|---|---|---|
| Comparison with Poisson distribution Blue bars denote a histogram of data divided into 1 sec bins. Red curve is a Poisson curve with rate = median count rate of data. |
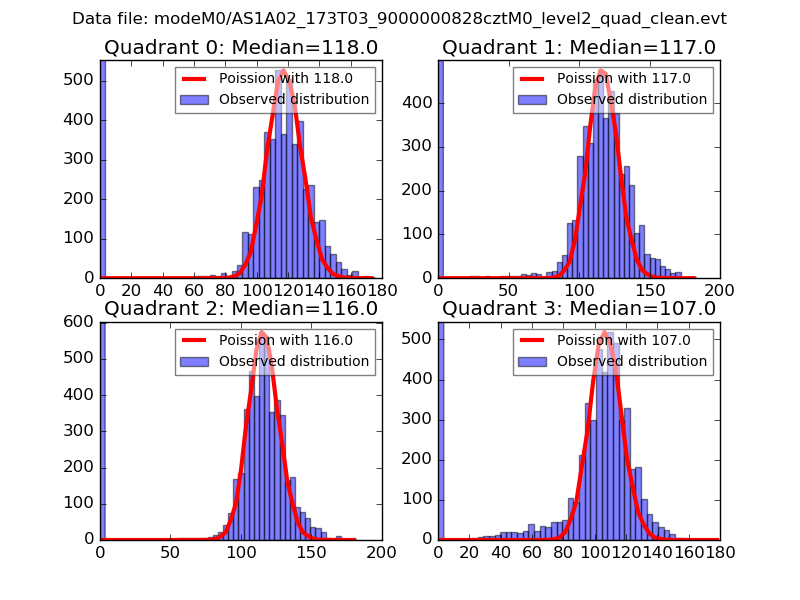 |
 |
| Quadrant-wise count rates Data is divided into 100 sec bins |
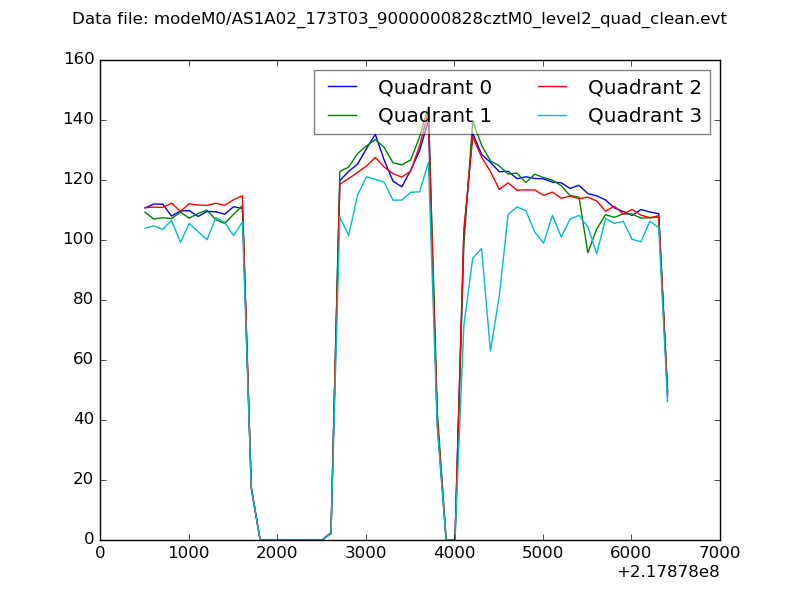 |
|
| Module-wise count rates for Quadrant A Data is divided into 100 sec bins |
 |
 |
| Module-wise count rates for Quadrant B Data is divided into 100 sec bins |
 |
 |
| Module-wise count rates for Quadrant C Data is divided into 100 sec bins |
 |
 |
| Module-wise count rates for Quadrant D Data is divided into 100 sec bins |
 |
 |
| Parameter | Plot |
|---|---|
| CZT HV Monitor | 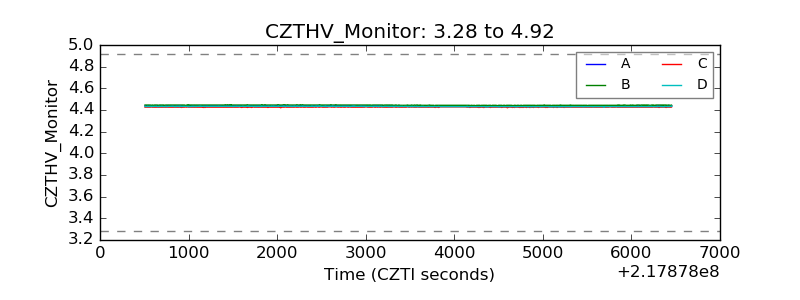 |
| D_VDD |  |
| Temperature 1 |  |
| Veto HV Monitor |  |
| Veto LLD |  |
| Alpha Counter |  |
| _CPM_Rate |  |
| CZT Counter |  |
| +2.5 Volts monitor |  |
| +5 Volts monitor | 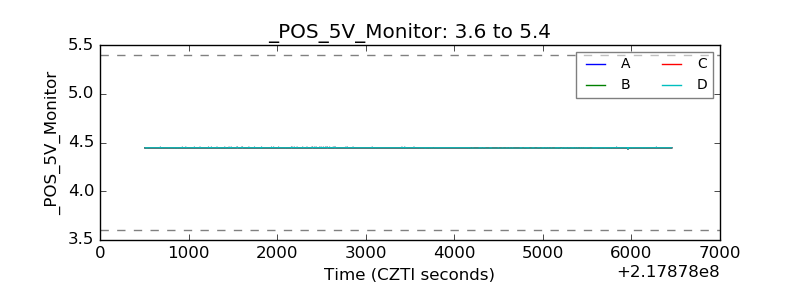 |
| _ROLL_ROT |  |
| _Roll_DEC |  |
| _Roll_RA |  |
| Veto Counter |  |