| Param | Original file | Final file |
|---|---|---|
| Filename | modeM0/AS1A02_070T01_9000000832cztM0_level2.evt | modeM0/AS1A02_070T01_9000000832cztM0_level2_quad_clean.evt |
| Size (bytes) | 8,076,591,360 | 1,228,777,920 |
| Size | 7.5 GB | 1.1 GB |
| Events in quadrant A | 53,503,063 | 7,649,332 |
| Events in quadrant B | 57,606,426 | 7,721,816 |
| Events in quadrant C | 46,150,790 | 7,789,941 |
| Events in quadrant D | 80,507,977 | 7,100,774 |
| Mode M0 | |||
|---|---|---|---|
| Quadrant | BADHDUFLAG | Total packets | Discarded packets |
| A | 0 | 225247 | 0 |
| B | 0 | 238985 | 0 |
| C | 0 | 208856 | 0 |
| D | 0 | 309087 | 0 |
| Mode SS | |||
|---|---|---|---|
| Quadrant | BADHDUFLAG | Total packets | Discarded packets |
| A | 0 | 2064 | 0 |
| B | 0 | 2064 | 0 |
| C | 0 | 2064 | 0 |
| D | 0 | 2064 | 0 |
| Mode M9 | |||
|---|---|---|---|
| Quadrant | BADHDUFLAG | Total packets | Discarded packets |
| A | 0 | 151 | 0 |
| B | 0 | 151 | 0 |
| C | 0 | 151 | 0 |
| D | 0 | 151 | 0 |
| Quadrant | Total seconds | Saturated seconds | Saturation percentage |
|---|---|---|---|
| A | 101473 | 1461 | 1.439792% |
| B | 101473 | 3545 | 3.493540% |
| C | 101473 | 616 | 0.607058% |
| D | 101473 | 8214 | 8.094764% |
Noise dominated data is calculated using 1-second bins in cleaned event files. If a bin has >2000 counts, and if more than 50% of those come from <1% of pixels, then it is considered to be noise-dominated and hence unusable.
| Quadrant | # 1 sec bins | Bins with >0 counts | Bins with >2000 counts | High rate bins dominated by noise | Noise dominated (total time) | Noise dominated (detector-on time) | Marked lightcurve |
|---|---|---|---|---|---|---|---|
| A | 116362 | 101476 | 278 | 278 | 0.24% | 0.27% |  |
| B | 116362 | 101475 | 1837 | 1837 | 1.58% | 1.81% |  |
| C | 116362 | 101481 | 37 | 37 | 0.03% | 0.04% |  |
| D | 116362 | 101477 | 6787 | 6787 | 5.83% | 6.69% |  |
Top three noisy pixels from each quadrant. If the there are fewer than three noisy pixels in the level2.evt file, extra rows are filled as -1
| Pixel properties | Quadrant properties | ||||||
|---|---|---|---|---|---|---|---|
| Quadrant | DetID | PixID | Counts | Sigma | Mean | Median | Sigma |
| A | 8 | 15 | 4176720 | 1729.25 | 11900 | 11641 | 2408.6 |
| A | 15 | 236 | 1199475 | 493.16 | 11900 | 11641 | 2408.6 |
| A | 13 | 251 | 980879 | 402.41 | 11900 | 11641 | 2408.6 |
| B | 3 | 64 | 9459519 | 4140.56 | 11959 | 11679 | 2281.8 |
| B | 4 | 81 | 788019 | 340.23 | 11959 | 11679 | 2281.8 |
| B | 15 | 204 | 498869 | 213.51 | 11959 | 11679 | 2281.8 |
| C | 1 | 16 | 439347 | 160.52 | 11582 | 11655 | 2664.4 |
| C | 4 | 254 | 344298 | 124.85 | 11582 | 11655 | 2664.4 |
| C | 9 | 54 | 117898 | 39.87 | 11582 | 11655 | 2664.4 |
| D | 2 | 63 | 20544626 | 7481.36 | 11285 | 10936 | 2744.6 |
| D | 12 | 220 | 6960075 | 2531.89 | 11285 | 10936 | 2744.6 |
| D | 12 | 221 | 3241304 | 1176.97 | 11285 | 10936 | 2744.6 |
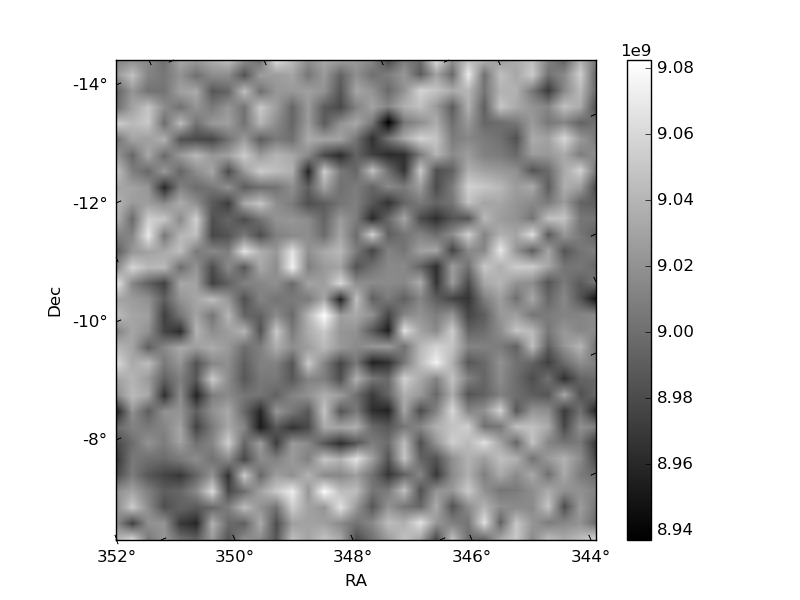
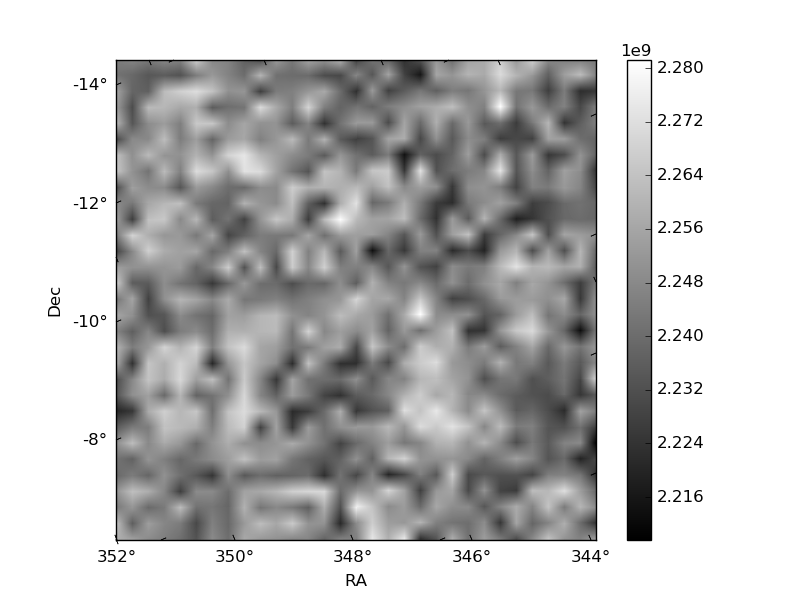
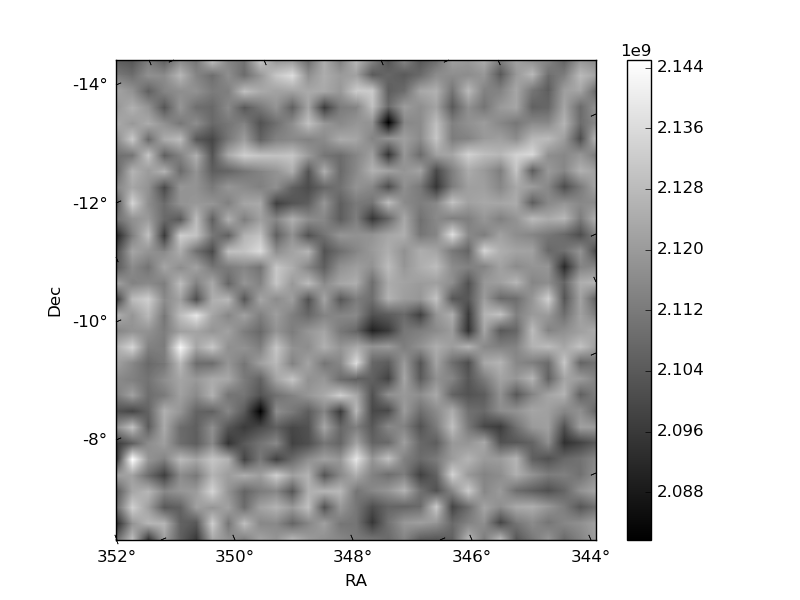
Histogram calculated using DETX and DETY for each event in the final _common_clean file
| Quadrant A |  |
 |
Quadrant B |
|---|---|---|---|
| Quadrant D |  |
 |
Quadrant C |
| Plot type | Count rate plots | Images |
|---|---|---|
| Comparison with Poisson distribution Blue bars denote a histogram of data divided into 1 sec bins. Red curve is a Poisson curve with rate = median count rate of data. |
 |
 |
| Quadrant-wise count rates Data is divided into 100 sec bins |
 |
|
| Module-wise count rates for Quadrant A Data is divided into 100 sec bins |
 |
 |
| Module-wise count rates for Quadrant B Data is divided into 100 sec bins |
 |
 |
| Module-wise count rates for Quadrant C Data is divided into 100 sec bins |
 |
 |
| Module-wise count rates for Quadrant D Data is divided into 100 sec bins |
 |
 |
| Parameter | Plot |
|---|---|
| CZT HV Monitor |  |
| D_VDD |  |
| Temperature 1 |  |
| Veto HV Monitor |  |
| Veto LLD |  |
| Alpha Counter |  |
| _CPM_Rate |  |
| CZT Counter |  |
| +2.5 Volts monitor |  |
| +5 Volts monitor | 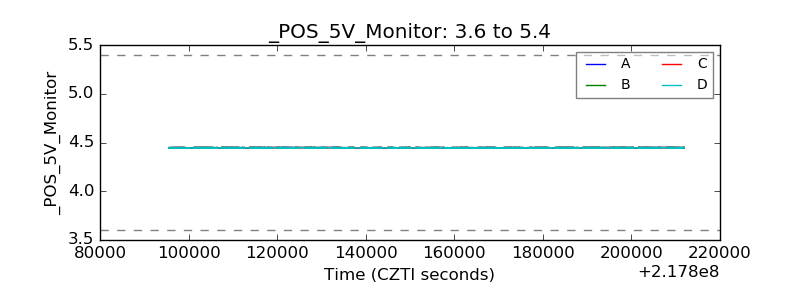 |
| _ROLL_ROT |  |
| _Roll_DEC |  |
| _Roll_RA |  |
| Veto Counter | 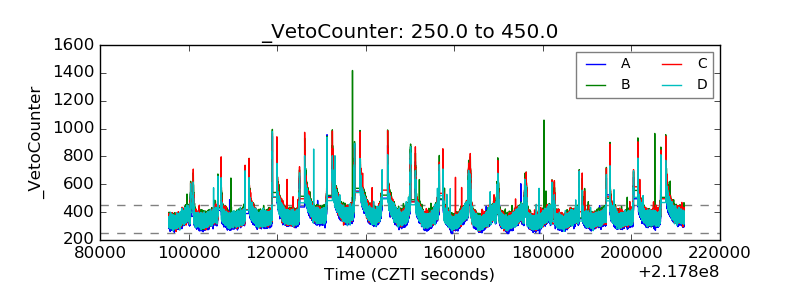 |