| Param | Original file | Final file |
|---|---|---|
| Filename | modeM0/AS1A02_118T01_9000000826cztM0_level2.evt | modeM0/AS1A02_118T01_9000000826cztM0_level2_quad_clean.evt |
| Size (bytes) | 7,685,507,520 | 1,377,144,000 |
| Size | 7.2 GB | 1.3 GB |
| Events in quadrant A | 51,202,014 | 9,157,783 |
| Events in quadrant B | 52,249,695 | 9,087,621 |
| Events in quadrant C | 37,861,894 | 9,200,062 |
| Events in quadrant D | 85,625,376 | 8,334,338 |
| Mode M0 | |||
|---|---|---|---|
| Quadrant | BADHDUFLAG | Total packets | Discarded packets |
| A | 0 | 209830 | 0 |
| B | 0 | 214207 | 0 |
| C | 0 | 176615 | 0 |
| D | 0 | 314347 | 0 |
| Mode SS | |||
|---|---|---|---|
| Quadrant | BADHDUFLAG | Total packets | Discarded packets |
| A | 0 | 1766 | 0 |
| B | 0 | 1766 | 0 |
| C | 0 | 1766 | 0 |
| D | 0 | 1766 | 0 |
| Mode M9 | |||
|---|---|---|---|
| Quadrant | BADHDUFLAG | Total packets | Discarded packets |
| A | 0 | 137 | 0 |
| B | 0 | 137 | 0 |
| C | 0 | 137 | 0 |
| D | 0 | 137 | 0 |
| Quadrant | Total seconds | Saturated seconds | Saturation percentage |
|---|---|---|---|
| A | 86508 | 1308 | 1.511999% |
| B | 86508 | 4545 | 5.253849% |
| C | 86508 | 784 | 0.906275% |
| D | 86508 | 10872 | 12.567624% |
Noise dominated data is calculated using 1-second bins in cleaned event files. If a bin has >2000 counts, and if more than 50% of those come from <1% of pixels, then it is considered to be noise-dominated and hence unusable.
| Quadrant | # 1 sec bins | Bins with >0 counts | Bins with >2000 counts | High rate bins dominated by noise | Noise dominated (total time) | Noise dominated (detector-on time) | Marked lightcurve |
|---|---|---|---|---|---|---|---|
| A | 100400 | 86514 | 50 | 50 | 0.05% | 0.06% |  |
| B | 100400 | 86512 | 2466 | 2466 | 2.46% | 2.85% |  |
| C | 100400 | 86514 | 12 | 12 | 0.01% | 0.01% |  |
| D | 100400 | 86511 | 9522 | 9522 | 9.48% | 11.01% |  |
Top three noisy pixels from each quadrant. If the there are fewer than three noisy pixels in the level2.evt file, extra rows are filled as -1
| Pixel properties | Quadrant properties | ||||||
|---|---|---|---|---|---|---|---|
| Quadrant | DetID | PixID | Counts | Sigma | Mean | Median | Sigma |
| A | 8 | 15 | 8791378 | 4425.39 | 9862 | 9645 | 1984.4 |
| A | 15 | 236 | 3612080 | 1815.38 | 9862 | 9645 | 1984.4 |
| A | 13 | 251 | 331908 | 162.4 | 9862 | 9645 | 1984.4 |
| B | 3 | 64 | 8044108 | 4395.19 | 9804 | 9558 | 1828.0 |
| B | 0 | 219 | 3754846 | 2048.81 | 9804 | 9558 | 1828.0 |
| B | 15 | 204 | 1129737 | 612.78 | 9804 | 9558 | 1828.0 |
| C | 1 | 16 | 218790 | 95.88 | 9599 | 9629 | 2181.6 |
| C | 9 | 54 | 132388 | 56.27 | 9599 | 9629 | 2181.6 |
| C | 13 | 61 | 77019 | 30.89 | 9599 | 9629 | 2181.6 |
| D | 2 | 63 | 29194945 | 13154.18 | 9210 | 8915 | 2218.8 |
| D | 12 | 220 | 12959007 | 5836.62 | 9210 | 8915 | 2218.8 |
| D | 2 | 152 | 2991104 | 1344.08 | 9210 | 8915 | 2218.8 |
Histogram calculated using DETX and DETY for each event in the final _common_clean file
| Quadrant A |  |
 |
Quadrant B |
|---|---|---|---|
| Quadrant D | 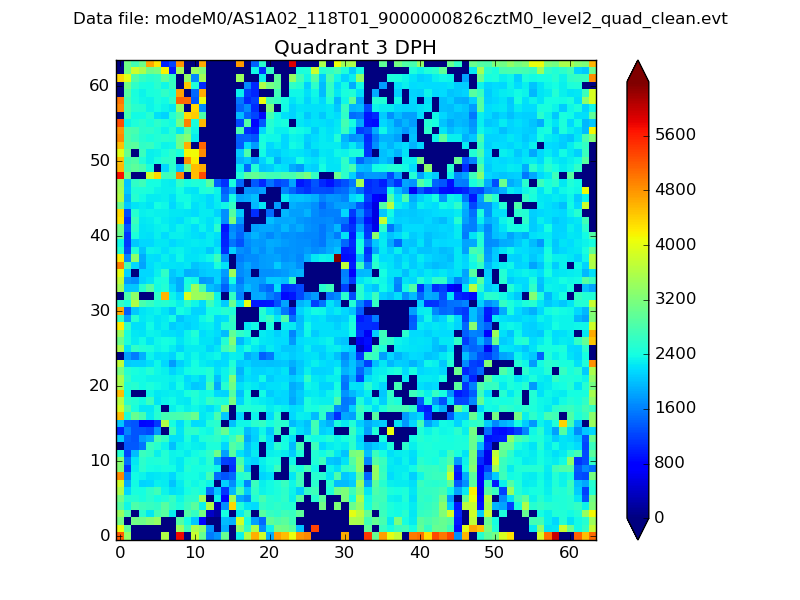 |
 |
Quadrant C |
| Plot type | Count rate plots | Images |
|---|---|---|
| Comparison with Poisson distribution Blue bars denote a histogram of data divided into 1 sec bins. Red curve is a Poisson curve with rate = median count rate of data. |
 |
 |
| Quadrant-wise count rates Data is divided into 100 sec bins |
 |
|
| Module-wise count rates for Quadrant A Data is divided into 100 sec bins |
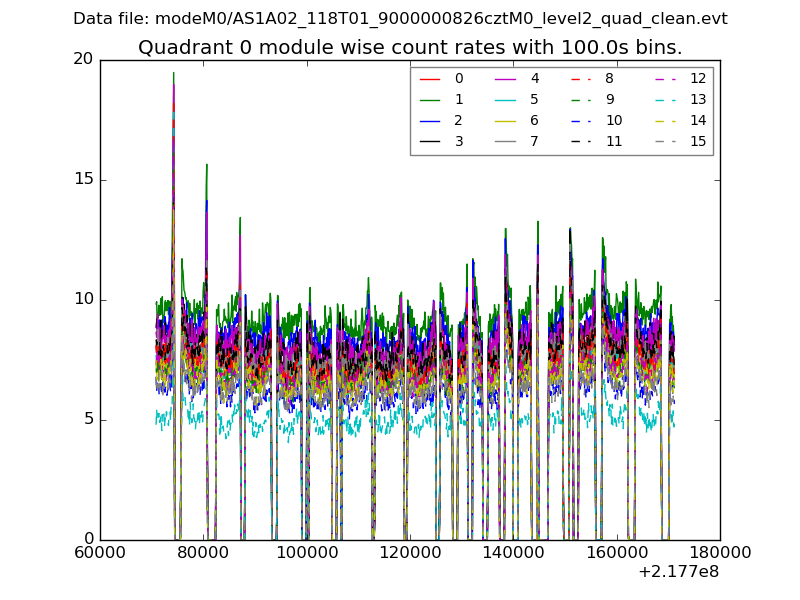 |
 |
| Module-wise count rates for Quadrant B Data is divided into 100 sec bins |
 |
 |
| Module-wise count rates for Quadrant C Data is divided into 100 sec bins |
 |
 |
| Module-wise count rates for Quadrant D Data is divided into 100 sec bins |
 |
 |
| Parameter | Plot |
|---|---|
| CZT HV Monitor |  |
| D_VDD |  |
| Temperature 1 | 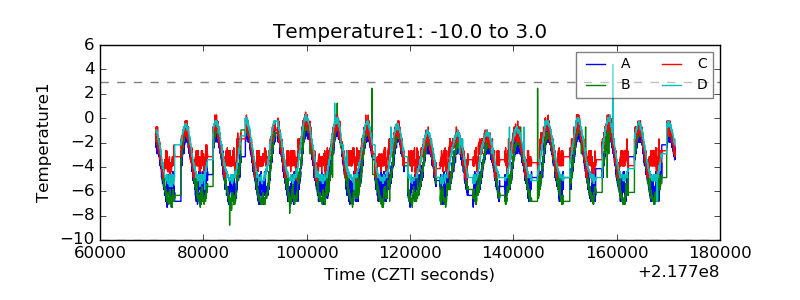 |
| Veto HV Monitor |  |
| Veto LLD |  |
| Alpha Counter | 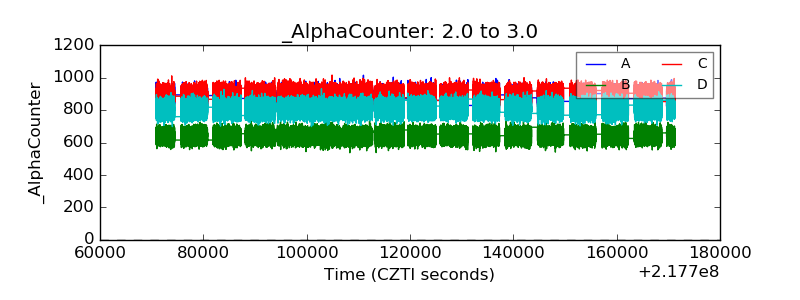 |
| _CPM_Rate |  |
| CZT Counter |  |
| +2.5 Volts monitor |  |
| +5 Volts monitor |  |
| _ROLL_ROT |  |
| _Roll_DEC | 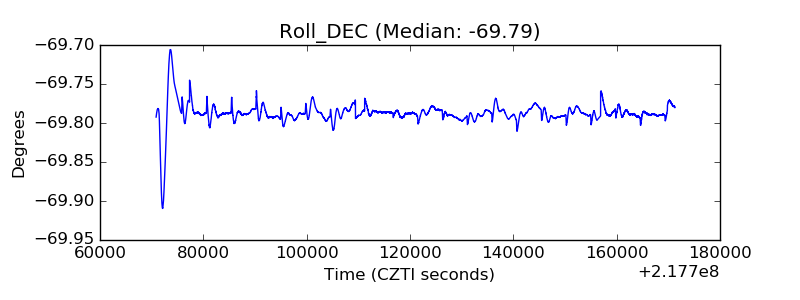 |
| _Roll_RA |  |
| Veto Counter |  |